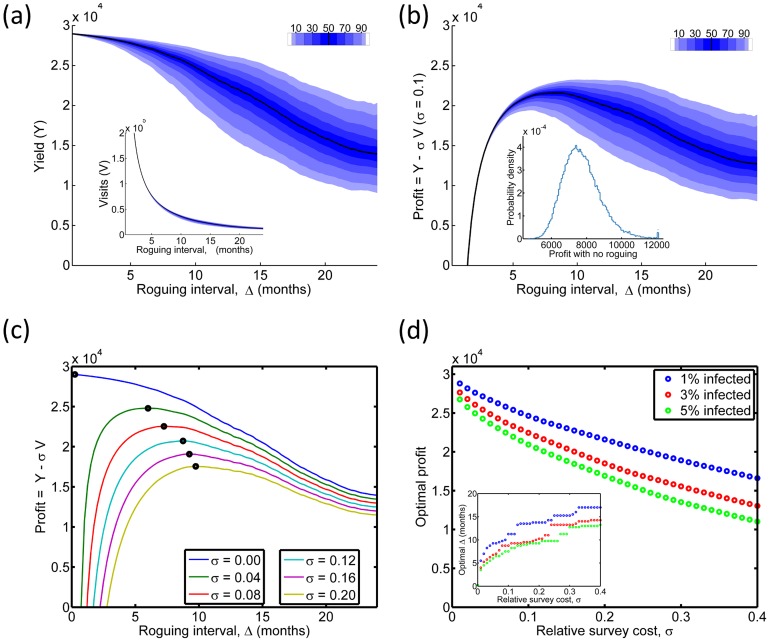
Figure 6. Economics of roguing.
(a) Responses of the total yield,  , and the total number of visits to individual plants,
  , (shown in inset) both over the twenty year nominal lifetime of the grove, to the roguing interval,
  . The initial level of infection
  was 4%. (b) The profit,
  , as a function of
  , when the relative cost of surveying,
  , is fixed at
  , again for
  . The distribution of profit when there is no roguing is shown in the histogram in the inset. (c) Responses of
  to
to  for different values of
  . The black dots denote the roguing interval for which maximum profitability was attained. In all cases
  . (d) The maximum
  , and the value of
  at which this maximum profit was attained (inset), for a range of values of
  and for different values of
  .
.

