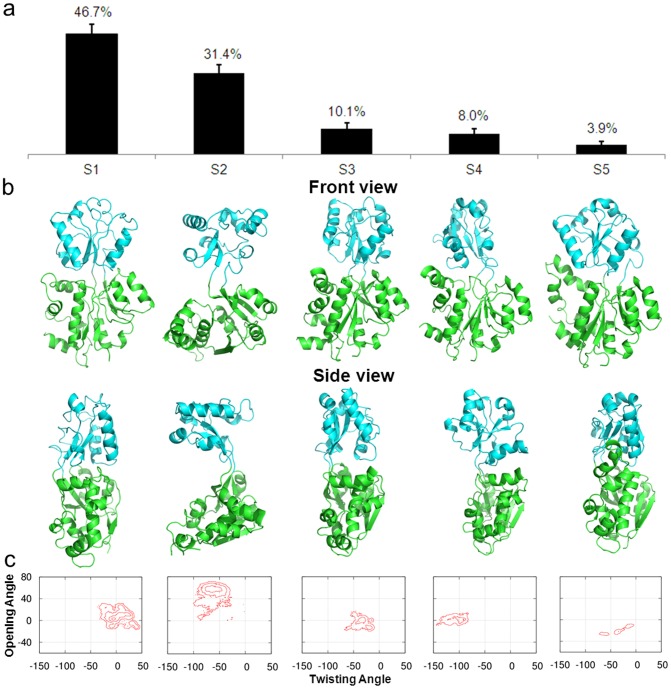
Figure 3. (a) The equilibrium populations of five metastable states obtained from the MSM for apo ChoX.
(b) Representative conformations from these five states. The two domains of the protein are colored in cyan and green respectively, and two viewpoints, front and side views, are shown. (c) Projections of free energy landscape on the protein opening and twisting angle for each metastable conformational state. The interval between two adjacent contour levels is 1 kT.

