
Figure 3.
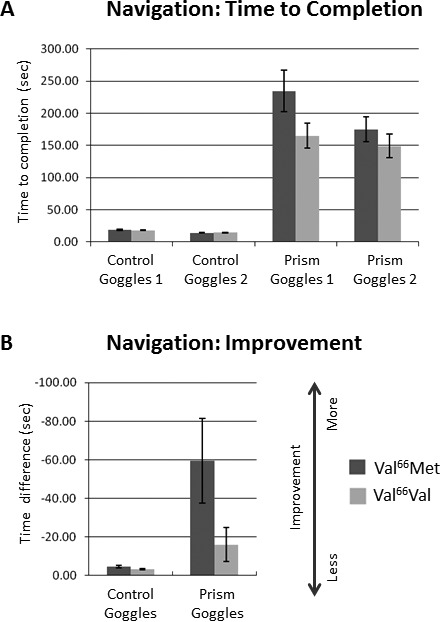
Navigation Task Performance. (A) Navigation: Time to Completion. The average amount of time subjects took to touch all 10 targets in the walking navigation task is plotted for each trial (goggles 1 and 2) in each condition (control goggles and prism goggles). (B) Navigation: Improvement. Block 2 – Block 1 difference in time to completion. Note the similarity of the overall pattern of results to the Reaching Task in Figure 2D. Other details are as in Figure 2.