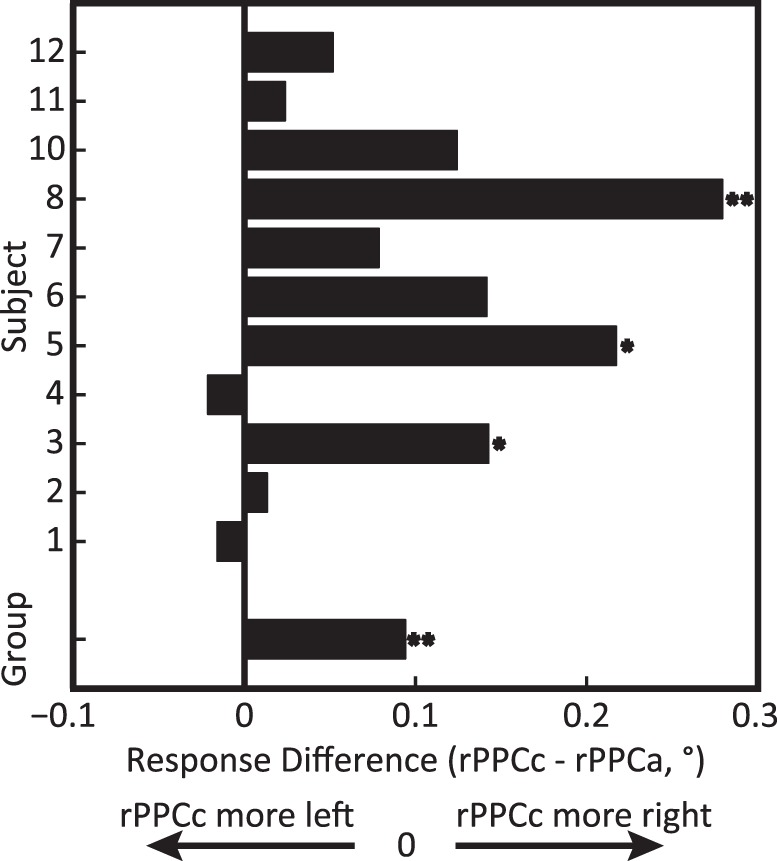
Figure 2.

Experiment 1: tDCS-induced mislocalization after tDCS, comparing rPPCc and rPPCa stimulation. Bars show the difference in average response errors between the rPPCc and rPPCa conditions for each subject and the group average (bottom bar). Positive values indicate rPPCc responses that were shifted more to the right relative to the rPPCa responses. One asterisk denotes individual significance with p < 0.05 and two asterisks denotes p < 0.01 (see Methods, Significance tests). The rPPCc montage shifted perceived centroid location rightward compared to the rPPCa montage, supporting the involvement of the PPC in localization.
