
Figure 3.
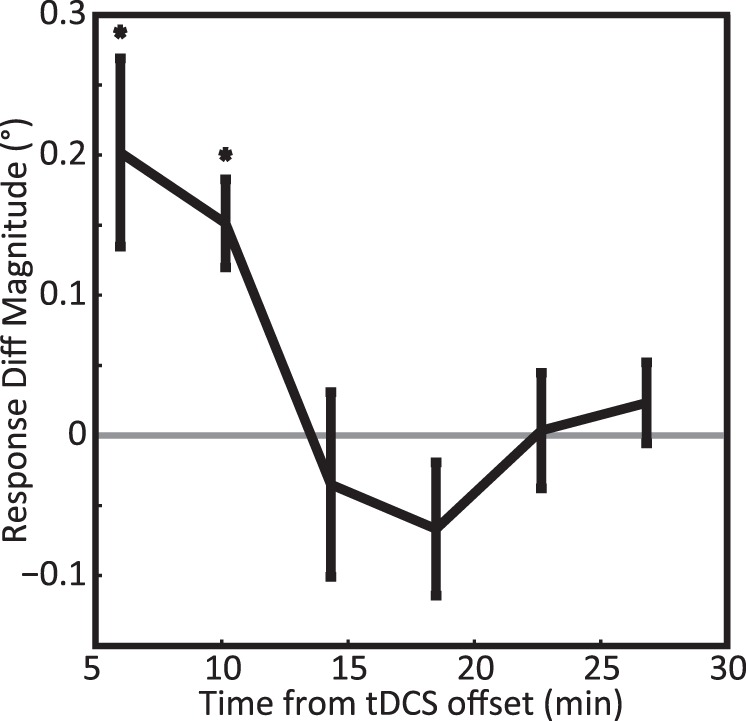
Experiment 1: Time course of response errors after tDCS. The black curve shows the response differences, rPPCc – rPPCa, as a function of time, averaged across all subjects. Positive values indicate that rPPCc stimulation shifted the perceived centroid rightward relative to rPPCa stimulation. One asterisk denotes significance at p < 0.05. The graph shows that the aftereffect of tDCS dissipated over a period of ∼15 min.