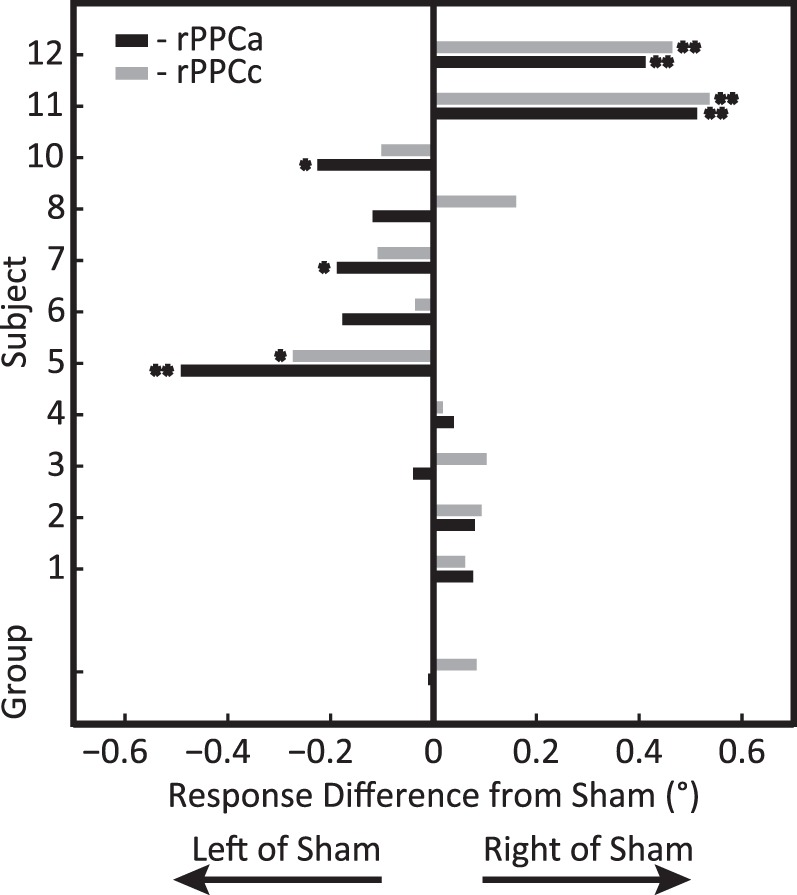
Figure 4.

Experiment 1: tDCS-induced mislocalization after tDCS comparing rPPCc (gray) and rPPCa (black) to sham stimulation for each subject and the group average (bottom bars). Positive values indicate rightward shifts relative to sham. Asterisks indicate significance (*p < 0.05; **p < 0.01) for a specific subject and stimulation condition compared to sham. This graph shows that the sign of the behavioral effect differed across subjects, but that rPPCc effects were typically more rightward than rPPCa effects (see also Figure 2).
