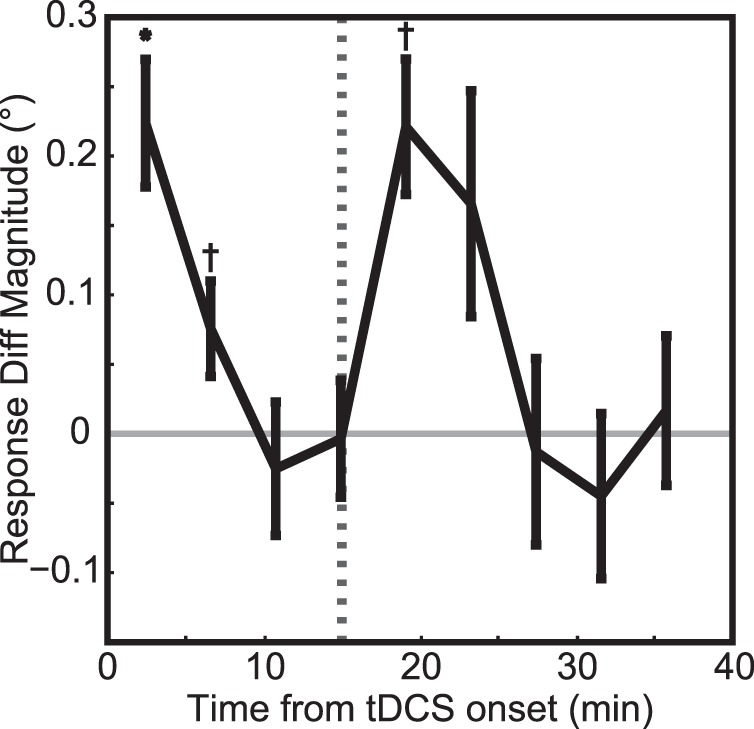
Figure 5.

Experiment 2: Time course of response errors during and after tDCS. The black curve shows the response differences, rPPCc – rPPCa, as a function of time, averaged across all subjects (see Methods, Population response error functions over time). Positive values indicate that rPPCc stimulation shifted the perceived centroid rightward relative to the rPPCa stimulation condition. The dashed line indicates tDCS offset. One asterisk denotes significance with p < 0.05 and a cross denotes a trend at p < 0.10. This figure shows that tDCS induced both short-term effects that dissipated even while current was applied and an aftereffect that lasted ∼10 min (as in Figure 3).
