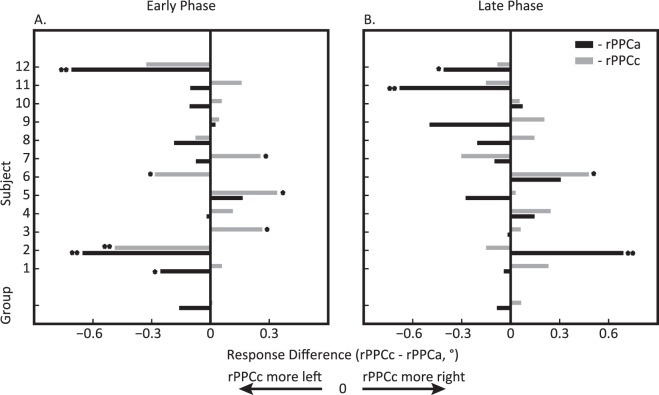
Figure 7.
Experiment 2: tDCS-induced mislocalization during and after tDCS comparing rPPCc (gray) and rPPCa (black) to sham stimulation for each subject and the group average (bottom bars). (A) Early phase during tDCS: 0–8 min after tDCS onset and (B) late phase after tDCS offset: 2–10 min after tDCS offset. Positive values indicate rightward shifts relative to sham. These graphs show a large degree of intersubject variability when comparing stimulation to sham, but—as shown in Figure 6—a consistently rightward shift when comparing rPPCc and rPPCa. One asterisk denotes individual significance with p < 0.05 and two asterisks denotes p < 0.01.

