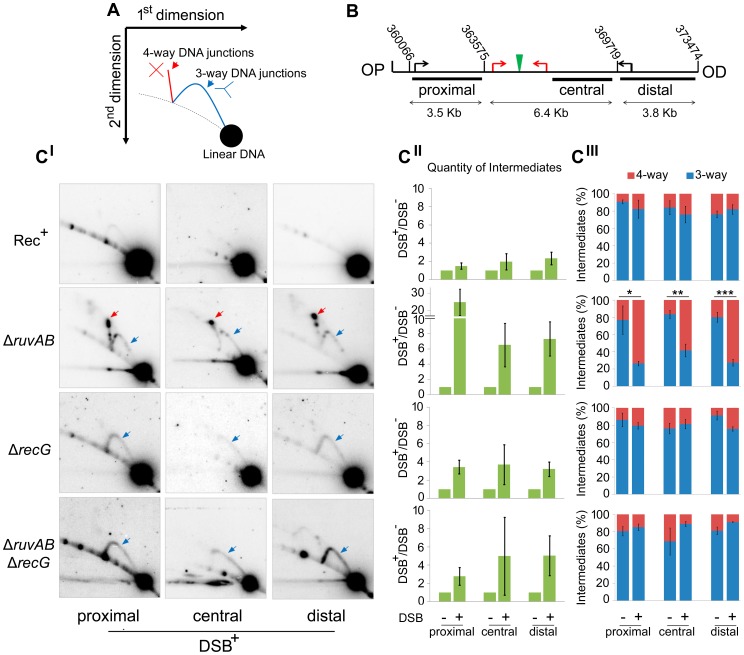
Figure 3. Intermediates of DSBR by 2D agarose gel electrophoresis.
(A) Schematic representation of a 2D gel illustrating the expected positions of 3-way (blue) and 4-way (red) DNA junction migration. (B) Map of the region of the chromosome showing the relative positions of the palindrome (green), the 3x χ arrays (red arrows), endogenous χ sites (black arrows) and the chromosomal coordinates of the relevant MfeI and SacI restriction sites used to generate the proximal, central and distal fragments. The relative position of probes used is indicated by black rectangles. OP and OD indicate origin-proximal and origin-distal sides of the break, respectively. (CI) 2D gels of the proximal, central and distal fragments for Rec+ (DL4184), ΔruvAB (DL4243), ΔrecG (DL4311), and ΔruvAB ΔrecG (DL4260) strains containing the palindrome, exposed to 0.2% arabinose for 60 minutes. 3-way and 4-way DNA junctions are highlighted by a blue and red arrow, respectively. (CII) Quantifications (represented as mean ± SEM where n = 3) of total amount of intermediates (3-way plus 4-way DNA junctions) accumulated by 2D gel electrophoresis. (CIII) Quantifications (represented as mean ± SEM where n = 3) of 3-way and 4-way DNA junctions. Statistical analysis was carried out using an unpaired T-test. * represents p<0.05, ** represents p<0.01 and *** represents p<0.005.

