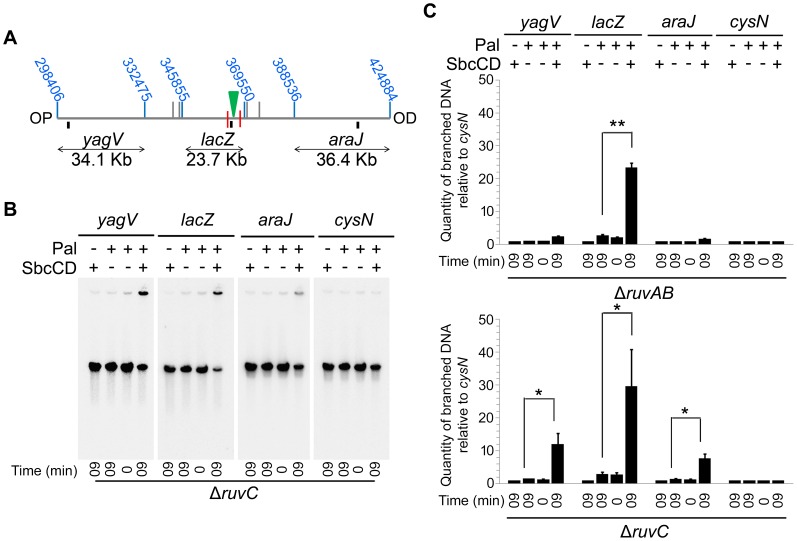
Figure 6. Detection of branch migration using PFGE.
(A) Map of the chromosome showing the three SalI fragments around the DSB. The coordinates of the restriction sites are shown in blue. The palindrome is shown as a green triangle and the 1.5 kb 3x χ arrays are shown as red lines. The relative position of probes are represented by small black rectangles. OP and OD indicate origin-proximal and origin-distal sides of the break, respectively. (B) Gel of branched DNA retained in the wells of PFGs from DNA isolated from ΔruvC (DL4913 and DL4914) mutants. Samples were run as in Figure 3. (C) Quantifications (represented as mean ± SEM where n = 3) of branched DNA retained in the wells of PFGs from DNA isolated from ΔruvAB (DL4243 and DL4257) mutants (gel shown in Figure 3C) and ΔruvC mutants (gel shown in panel B). Statistical analysis was carried out using a paired T-test. * represents p<0.05, ** represents p<0.01.

