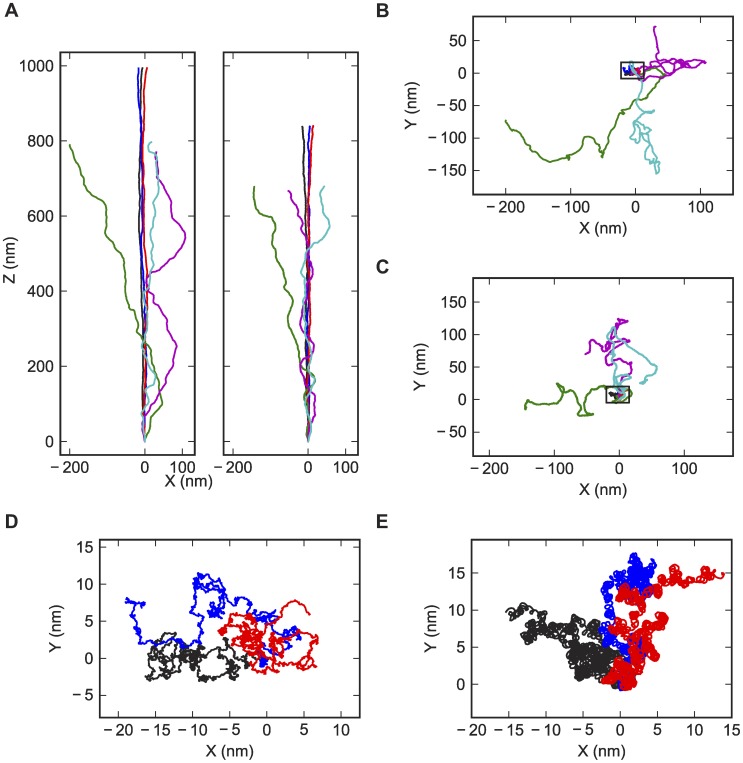
Figure 1. Visualizations of sample conformations from the simulations.
Only the axis curve of the helices are shown. Black, red and blue lines: conformations from simulations at 40 pN stretching force. Green, cyan and magenta lines: conformations from simulations at 0.4 pN stretching force. (A) Side view (projection on XZ plane). Left: DNA. Right: dsRNA. (B, D) DNA conformations. (C, E) dsRNA conformations. (B, C) Top view (projection on XY plane). (D, E) Top view showing only the 40 pN simulations.

