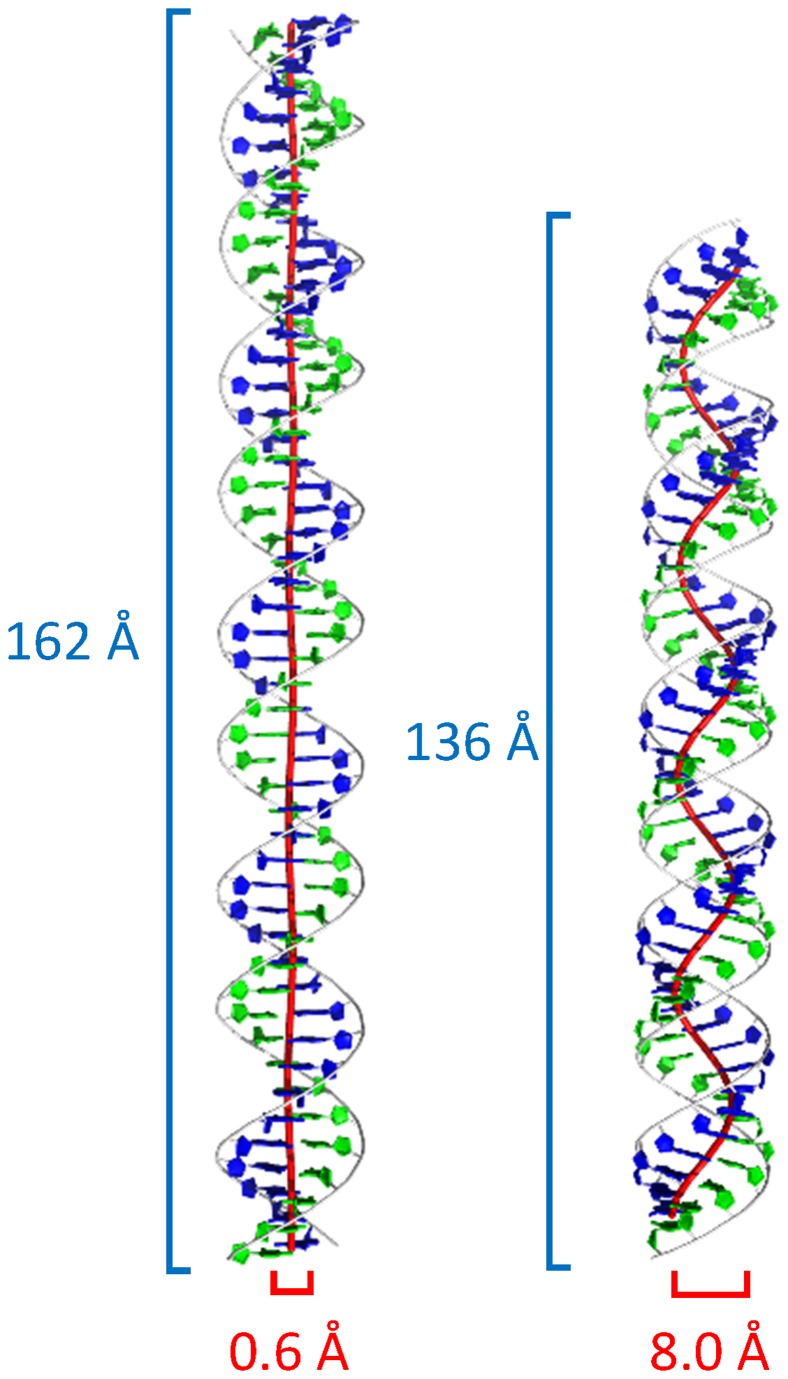
Figure 2. Structures and axis-curves for ideal dsDNA and dsRNA.
Left: DNA. Right: dsRNA. The length of the helices is 50 base-pairs. The red lines are the corresponding axis-curves, forming a spiral. Blue numbers are the vertical length of the axis-curve spirals and red numbers are the diameter of the spirals. The axis curve for dsRNA is more “springy” than DNA.

