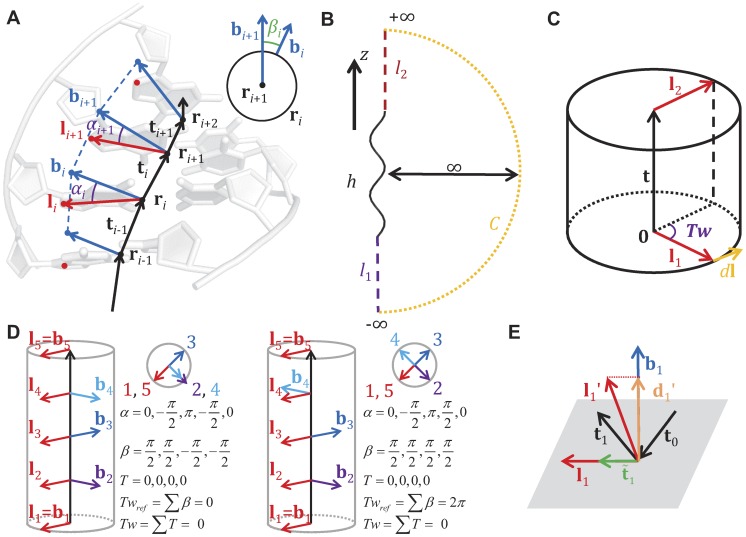
Figure 6. The base-pair level model and the twist and writhe calculation.
(A) Illustration of the base-pair level model and ribbon model abstraction. Black dots and vectors: centers of base-pairs and the axis curve; red vectors: original ribbon vectors; blue vectors: reference ribbon vectors. See the main text for definition of α and β. (B) Conversion from an open curve to a closed curve for writhe calculation. (C) Twist for a straight line segment. (D) Effect of using reference ribbon vectors in the middle of a helix. The corresponding α, β, T, Twref and Tw are given. The original ribbon (red) is perfectly straight with zero twist. Using reference ribbon vectors either leads to no change (left) or a 2π difference (right) in twist. Taking α into account resolves the 2π difference. (E) Cases where the twist definition of Britton et al. [56] would fail to give reasonable answers.

