
Figure 1. Algorithm and model for haplotypes.
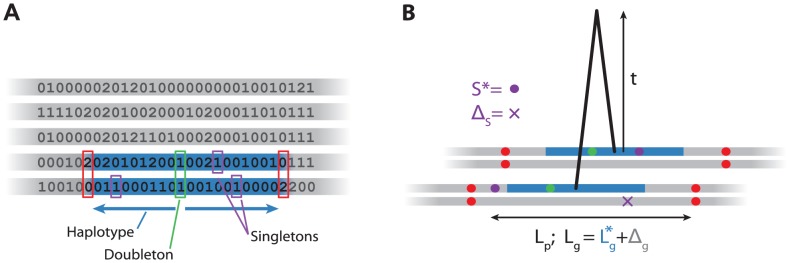
A: Algorithm for detecting  haplotypes. For each
  variant in the sample (green), we scan left and right until we find inconsistent homozygote genotypes (red), record the physical and genetic length of this region (blue), and the number of singletons (purple). B: Model for haplotype age
  . Consider the 4 chromosomes (grey) of the two individuals sharing an
  haplotype (blue). We model the total genetic length of the inferred haplotype,
  , as the sum of the true genetic length
  and an error
  . Similarly, we model the number of singletons
  as the sum of the number on the shared chromosome (
 ) and the number on the unshared chromosomes,
  . We ignore the fact that we overestimate
  and therefore that some of the singletons might lie in the unshared part of the chromosome.