
Figure 5. Comparison with MSMC, and the effect of estimating haplotypes with sequence data.

A: The age distribution of  haplotypes shared between CHB and CEU estimated with array, sequence and “clean” sequence (with indels and low complexity regions removed; Methods). Coloured dashed lines show the medians of each distribution. The grey stepped line shows relative cross-population coalescence rates estimated by MSMC (S. Schiffels, personal communication), and the grey dashed line shows the earliest date in the oldest time interval where this rate is less that 0.5. In both cases, we assume 30 years per generation and
 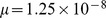 . B: As in A but for
  haplotypes shared between CHB and MXL, restricted to haplotypes where the MXL individual is inferred to be homozygous for Native American ancestry. C–D: Age distributions inferred using “clean” sequence data, comparable to Figure 3A 3A–B (Note the extended x-axis).