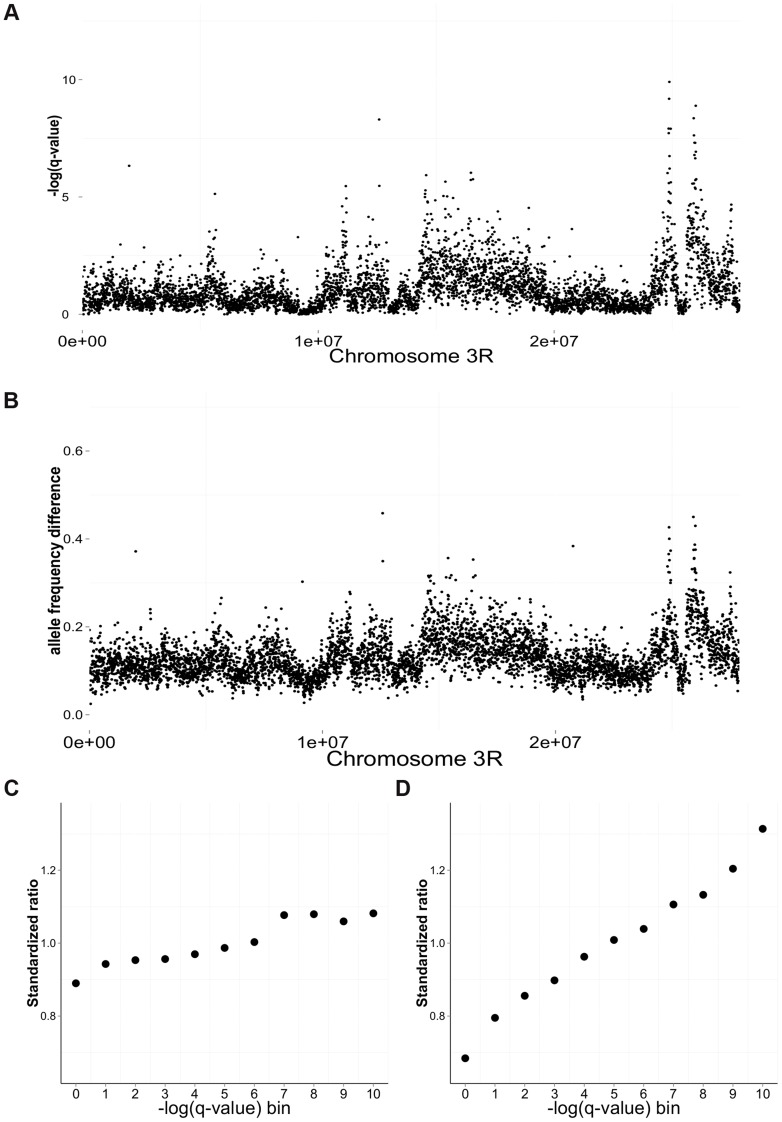
Figure 3. Differentiation between salt and cadmium populations.
Sliding-window (5 kb non-overlapping) plots of differentiation along chromosome 3R: the average -log(q-value) from the CMH test (A) and the average difference in mean allele frequency (B) between the salt and cadmium populations. For each environment, the data are calculated based on the environment-specific ancestor and the five replicate populations. The ratio of the number of genic to intergenic sites (C) and the ratio of the number of coding sites to intronic sites (D) in different -log(q-value) bins using data from the whole genome. To compare the magnitude of the ratios for different functional catergories, the ratios are standardized around 1 by dividing the mean ratio among the 11 bins. Strong significance corresponds to larger values of -log(q-value).

