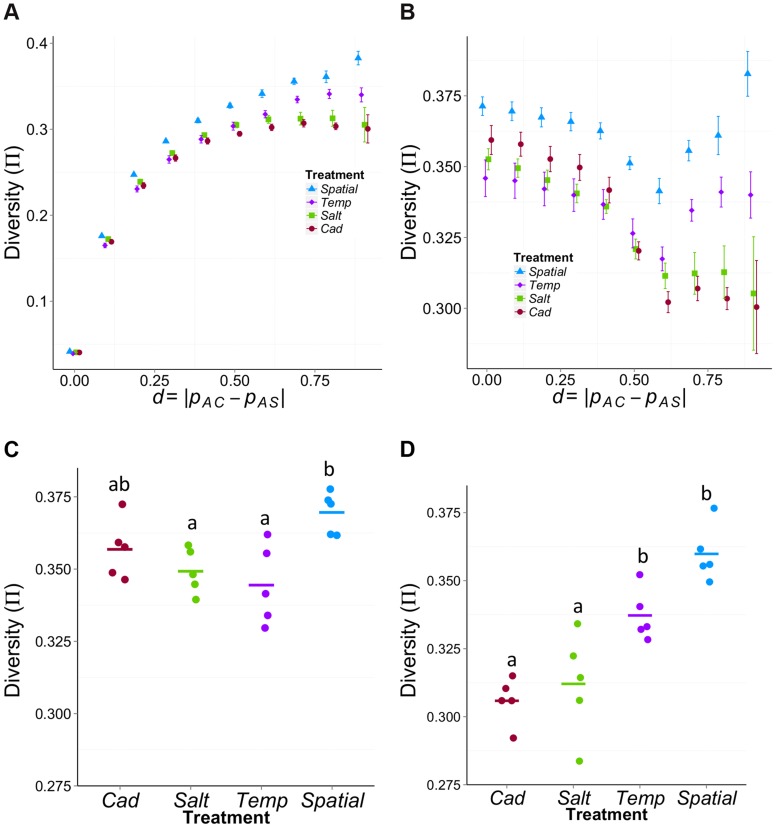
Figure 5. Mean π within treatments as function of differentiation (d) between the ancestral source populations (AC and AS).
(A) and (B) The average π across different levels of ancestral differentiation for (A) all χ-site SNPs or (B) only those χ-site SNPs that have high initial diversity (πini>0.4). The x-axis is the allele frequency difference between ancestral populations, d = |pAC−pAS|. Error bars represent the standard error among the five replicates for each treatment. (C) and (D) Comparison among treatments in average π for sites that have high initial diversity (πini>0.4) using sites with (C) weak ancestral differentiation (d<0.3) or (D) strong ancestral differentiation (d>0.7). For the weakly differentiated sites (C), Spatial has significantly higher diversity than the Temp (P adj = 0.006, Tukey HSD) and the Salt (P adj = 0.028). For the highly differentiated sites (D), both Spatial and Temp treatments have significantly higher diversity than the two constant treatments (P adj<0.03 between any a & b pairs).

