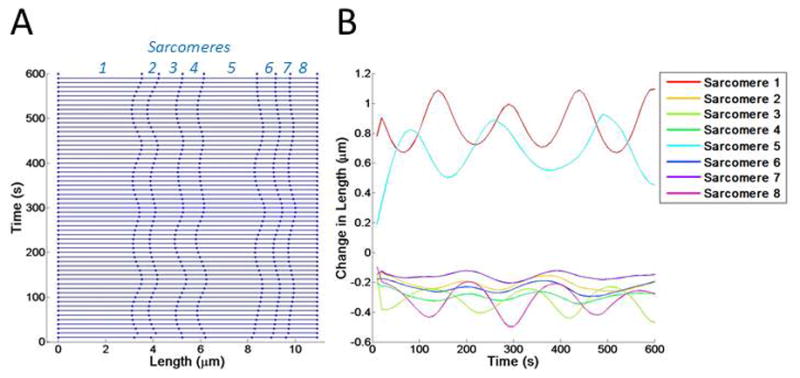
Figure 4. Introducing variable actin stiffness.

(A) Kymograph showing changes in sarcomere length over time. Sarcomeres 1–8 are indicated. (B) The changes in length of each sarcomere are shown with a colored line, corresponding to the sarcomere number.
