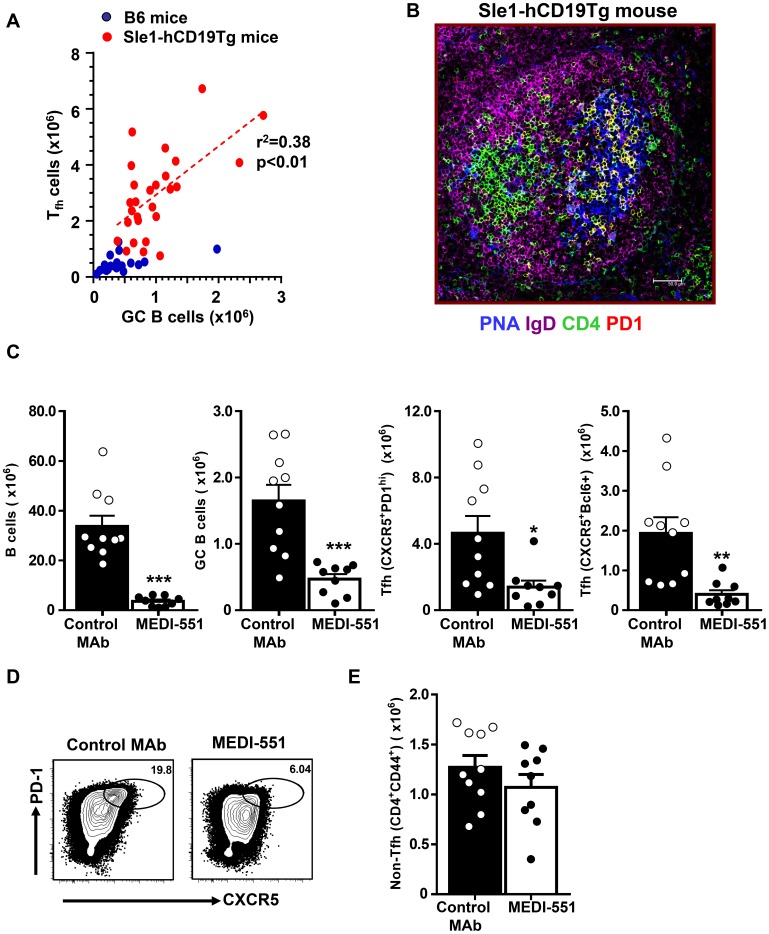
Figure 1. Depletion of splenic B cells in Sle1-hCD19Tg mice leads to a significant reduction of Tfh cells.
(A) Spleens were harvested from 5 to 12-month old Sle1-hCD19Tg mice and age-matched C57BL/6 (B6) control mice. Numbers of GC B cells (B220+CD19+PNA+FAShighIgDlow) and Tfh cells (CD4+CXCR5+PD1high) were enumerated by flow cytometry analysis and plotted in the graph. Each dot represents a single mouse of indicated genotype. (B) Immunofluorescence images of frozen spleen sections from a 10-month old Sle1-hCD19Tg mice. Cryosection are stained with PNA (for GC B cells, blue), IgD (naïve B cells, magenta), CD4 (green), and PD1 (red). Tfh cells are CD4 and PD1 double positive and therefore appear yellow. Majority of Tfh cells colocalize with PNA+ GC B cells. (C–E) Sle1-hCD19Tg mice were treated with a single dose of an anti-CD19 depleting MAb (MEDI-551) or control MAb (10 mg mg/kg) and spleen cells were collected for FACS analysis seven days after MAb administration. (C) Bar graphs show the number of B cells (B220+CD19+), GC B cells (PNA+FAShighIgDlow) and Tfh cells (CXCR5+PD1high or CXCR5+Bcl-6+). Bars represent the mean value for each group and error bars are standard error of the mean. (D) Representative FACS contour plots showing CXCR5 versus PD1 staining gated on CD4+CD44high cells from Sle1-hCD19Tg mice with indicated treatment. Gates have been drawn around the populations representing Tfh cells. (E) Bar graph showing the number of non-Tfh cells within CD4+CD44high effector and memory T cell gate (CD44highCXCR5−PD1low/−). *** P<0.001 **, P<0.01 *, P<0.05. Data in (C–E) are pooled from two independent experiments.

