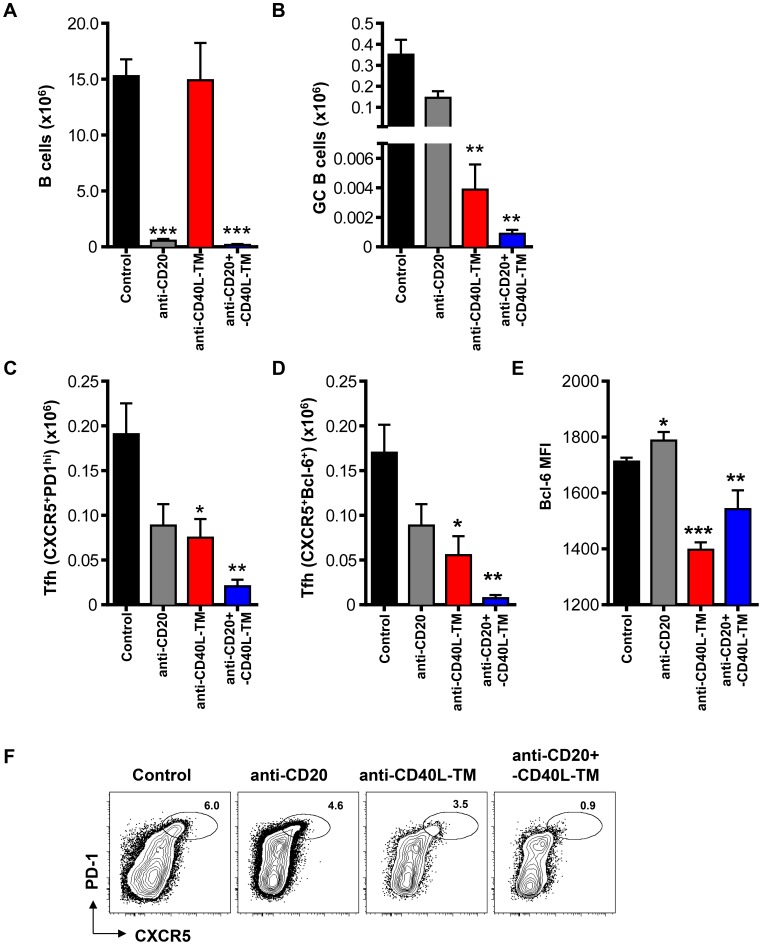
Figure 2. Reduction of GC B cells decreases the number of Tfh cells in NZB/W F1 mice.
(A–F) Female NZB/W F1 mice at 5–6 months of age were treated with anti-CD20 (1 mg mg/mouse), anti-CD40L-TM (1 mg mg/mouse), combination of anti-CD20 and CD40L-TM (1 mg each mg each/mouse) or isotype control antibodies (1 mg each mg each/mouse) intravenously on days 0 and 2. Mice were sacrificed and splenocytes were analyzed by FACS at day 7 post first antibody dosing. Bar graph shows numbers per spleen for (A) B cells (CD19+B220+), (B) GC B cells (PNA+FAShighIgDlow), (C) Tfh cells (CD4+CD44highCXCR5+PD1high) and (D) Tfh cells (CD4+CD44highCXCR5+Bcl-6+). (E) Bar graph shows the mean fluorescence intensity of Bcl-6 for Tfh (CD4+CD44highCXCR5+Bcl-6+) cells. ***P<0.001 **, P<0.01 *, P<0.05. Bars represent the mean value for each group and error bars are standard error of the mean. Data are pooled from three independent experiments. (F) Representative FACS contour plots showing PD1 versus CXCR5 staining gated on CD4+CD44high cells from mice with the indicated treatment 7 days after MAb dosing. Oval gates show the Tfh (CXCR5+PD1high) subsets.

