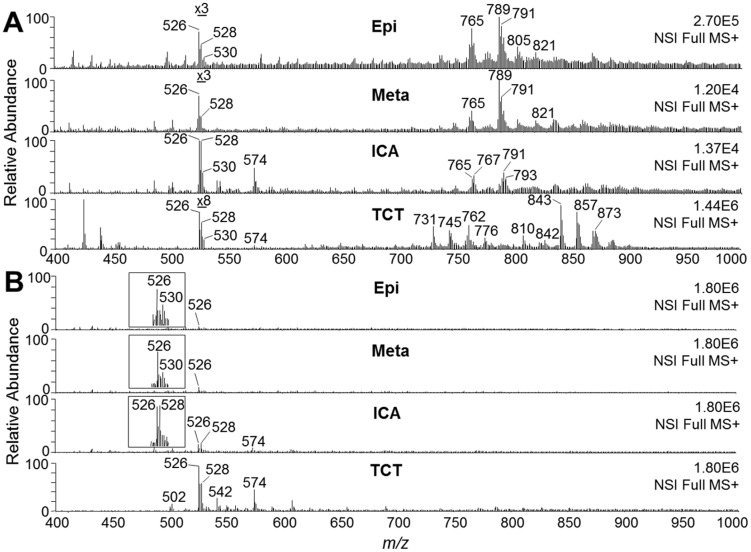
Figure 2. Full ESI-LIT-MS spectra of T. cruzi phospholipids.
(A) MS1 spectra of lipids obtained in the Folch lower phase prior to fractionation. Lipid samples from all T. cruzi stages were diluted in methanol containing 5 mM LiOH and analyzed by direct infusion in an LTQXL ESI-LIT-MS (positive-ion mode, MS+). Note that the region of spectrum corresponding to LPAF, LPC, and PAF species in Epi, Meta, and TCT has been magnified for better visualization. (B) MS1 spectra of phospholipids obtained by SPE followed by POROS R1 fractionation. Lipids eluted in 25% n-propanol were diluted in methanol containing 5 mM LiOH and analyzed as above. Since the same initial total number of cells (5×10⁸) was used for lipid fractionation from each parasite stage, all spectra were normalized. Magnification of the MS range where PAF and LPC species would be found is indicated (insets). Epi, epimastigote; Meta, metacyclic trypomastigote; ICA, intracellular amastigote; TCT, tissue culture-derived trypomastigote. m/z, mass to charge ratio.

