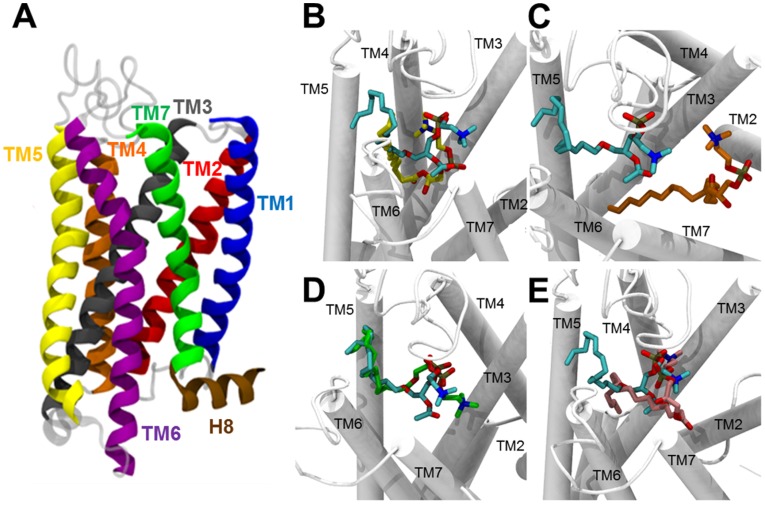
Figure 7. Structural representation of the PAFR model and its interaction with PAF and LPC species.
(A) Side view of PAFR model. Each TM (alpha-helix) is indicated in a different color: TM1, blue; TM2, red; TM3, dark gray; TM4, orange; TM5, yellow; TM6, purple; TM7, green. The helix 8 (H8) at the end of C-terminus region is indicated (brown). (B–E) Comparison of binding modes of PAF and each LPC species to PAFR. (B) C16:0-PAF (cyan) and C16:0-LPC (yellow); (C) C16:0-PAF (cyan) and C18:0-LPC (orange); (D) C16:0-PAF (cyan) and C18:1-LPC (green); and (E) C16:0-PAF (cyan) and C18:2-LPC (pink). Transmembrane (TM) regions are represented as white rods.

