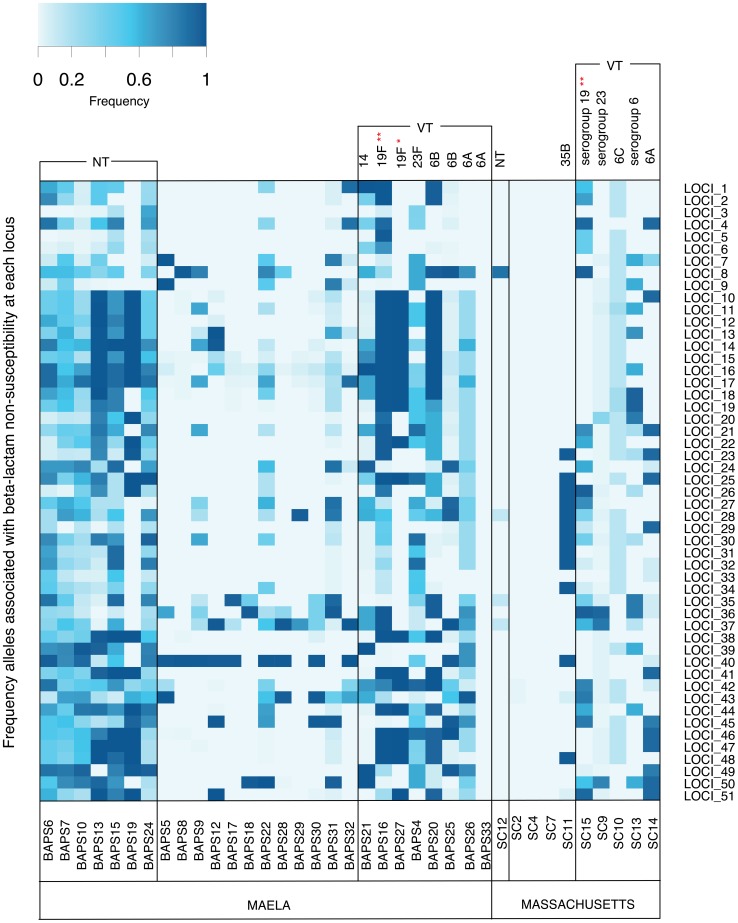
Figure 4. Frequency of putative resistance alleles from candidate loci in the Maela and Massachusetts populations.
The resistant allele frequency at each locus (rows) in each population cluster (columns) is represented by different shades on a blue-grey scale. Vaccine and non-vaccine serotype status of each cluster are shown at the top of each column. Asterisks highlight two drug resistant global clones: * represents the PMEN1 lineage; ** represents the PMEN14 lineage. Note that mixed population clusters have been removed from the diagram.

