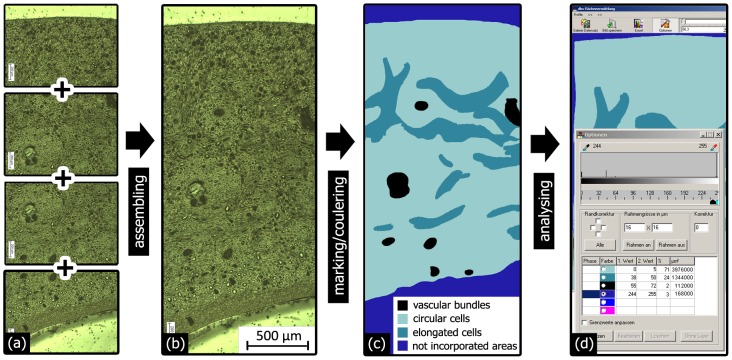
Figure 4. Schematic representation of how the relative area fractions of certain cell types and of the vascular bundles were analysed.
Several high resolution micrographs (a) were combined (b). The different cell types and the vascular bundles were marked and colour-coded (c). The area fractions were then determined by means of a quantitative image analysis software (d).

