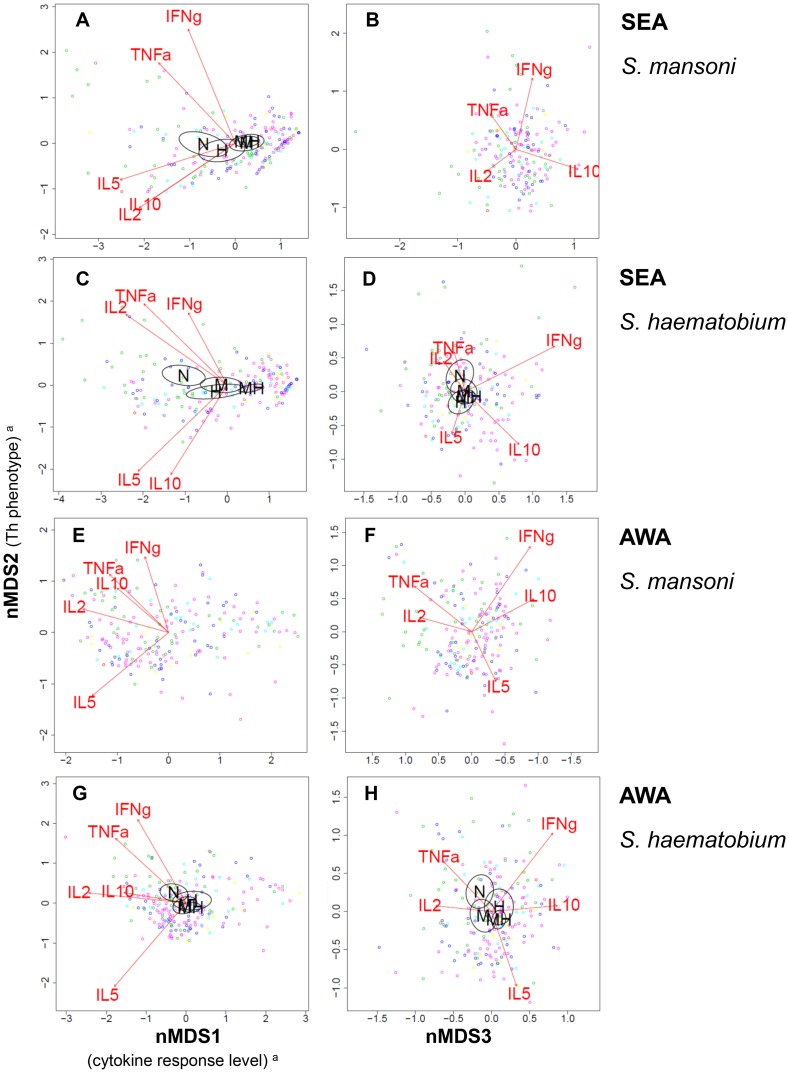
Figure 2. Variation in Schistosoma antigen-induced cytokine responses in relation to Schistosoma infection status.
Each three-dimensional (3D) nMDS ordination is represented in two 2D planes (Supporting Information S1) as in Figure 1: Left and right panels represent the 1st and 2nd, and 2nd and 3rd dimensions, respectively. Panels A and B show the S. mansoni egg antigen (SEAm)-induced cytokine profile, Panels C and D that of S. haematobium SEA(h), Panels E and F that of S. mansoni adult worm antigens (AWAm), and Panels G and H show S. haematobium AWA(h)-induced cytokine profiles. Dots represent individuals and distances between dots approximate the rank order of dissimilarities in cytokine profiles between the respective individuals with stress values (i.e. discrepancies) of 0.051 for SEAm, 0.041 for SEAh, 0.058 for AWAm, and 0.061 for AWAh. Red arrows indicate linear gradients of normalized net cytokine responses on which the nMDS is based. The length of the arrows is proportional to the goodness of fit onto the cytokine profile within one 2D plane, and arrows are only depicted if their fit was significant at the level of p = 0.05 in 3D ordinations (see Table 4), as well as in the respective 2D planes. Green dots represent uninfected individuals, dark blue those with single S. mansoni infections, light blue single S. haematobium, and the other colors indicate people with mixed infections: pink indicates mixed infections without ectopic egg elimination, yellow mixed infections with S. mansoni in feces as well as in urine and S. haematobium in urine, and red dots represent one individual with both S. mansoni and S. haematobium eggs in urine (possibly a hybrid species [4]–[6]; see also Table 1). Ellipsoids represent 95% confidence intervals for average group scores, for different infection statuses: uninfected (‘N’), single S. mansoni (‘M’), single S. haematobium (‘H’), versus mixed infection (‘MH’). Ellipsoids are drawn using the function ‘ordiellipse’, and only depicted if the fit of infection status onto the cytokine profile was significant at the level of p = 0.05 in 3D ordinations (see Table 4), as well as in the respective 2D planes. In Panel A and G, the labels for single S. mansoni (‘M’) and mixed infection (‘MH’) are overlapping. aThe biological a posteriori interpretation of nMDS1 (left x-axis) and nMDS2 (y-axis) were added between brackets on the axis labels, but nMDS3 (right x-axis) could not be interpreted.

