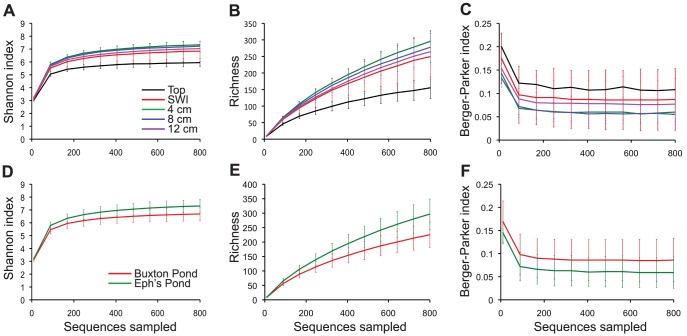
Figure 2. Alpha diversity of Winogradsky column samples.
Alpha diversity indices were calculated on rarefied samples. Samples were pooled by layer (A,B,C) or by sediment source (D,E,F) and the average Shannon index (A,D), richness (B,F) and Berger-Parker dominance index (C,F) were calculated. Error bars represent standard error for each category. Significant differences were seen between the Shannon index of top surface samples and samples taken from 4, 8, and 12 cm below the surface (A, non-parametric t-test, p = 0.021) and between sediment sources (D, nonparametric t-test, p = 0.001). Top surface samples were significantly less rich than samples at 4, 8, and 12 cm below the SWI (B, non-parametric t-test, p = 0.021 for surface vs. 4 cm, p cm, p = 0.021 surface vs. 8 cm, and p cm, and p = 0.042 for surface vs. 12 cm cm) and Eph's Pond columns are significantly more rich than Buxton Pond columns (E, non-parametric t-test, p = 0.002). Buxton Pond columns were significantly more dominated by single taxa than Eph's Pond columns (F, non-parametric t-test, p = 0.015).

