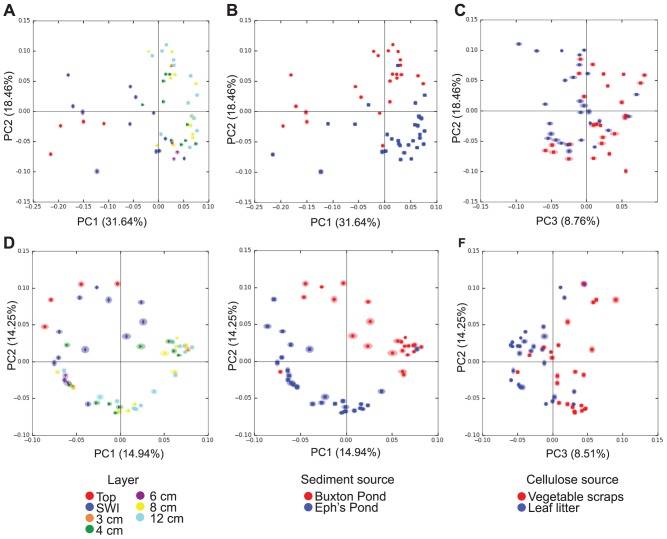
Figure 3. Principal coordinate analysis of Winogradsky column beta diversity.
Principal Coordinate plots of weighted UNIFRAC (A,B,C) and unweighted UNIFRAC (D,E,F) results were generated and colored by depth (A,D), sediment source (B,E) or cellulose source (C,F). 100 rarefactions were conducted at a depth of 800 sequences per sample to estimate robustness of beta diversity patterns. Shading around each point represents interquartile range of that point's placement as calculated based on rarefied PCoA.

