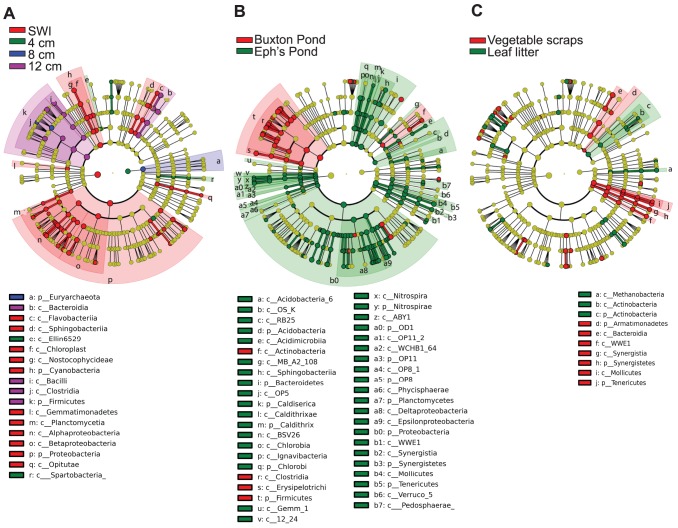
Figure 5. Cladograms of biomarkers for depth, sediment source, and cellulose source.
LEfSe was used to identify biomarkers that discriminate (A) depth, (B) sediment source, and (C) cellulose source in Winogradsky columns. Concentric rings from outside in are genus, family, order, class and phylum, with the two central circles for bacteria and archaea. All taxa present are shown, with colored circles representing biomarkers and yellow circles representing non-discriminating taxa. Shaded areas show all taxa below phylum or class biomarkers. For clarity, only biomarkers at the phylum and class levels are labeled.

