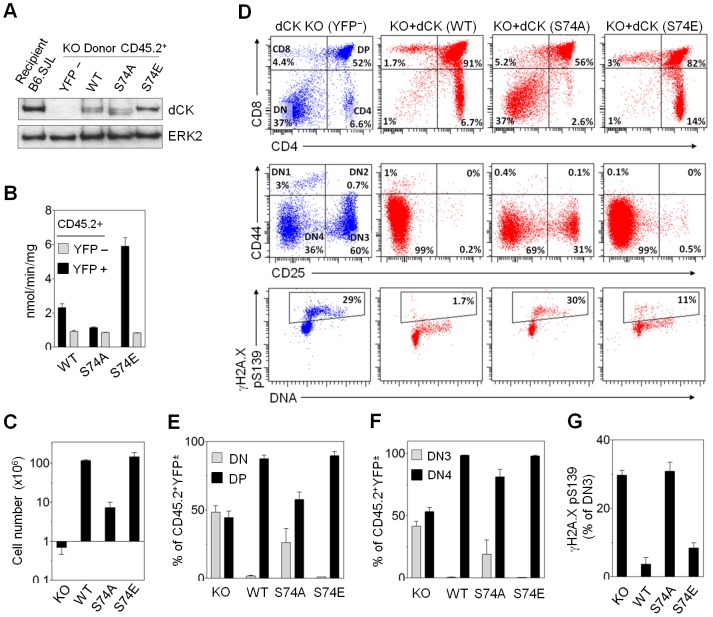
Figure 6. DCK Ser74 influences T cell development.
(A) Western blot of CD45.2+ dCK KO cells (YFP−) carrying one of three dCK isoforms (WT, S74A, S74E; YFP+). Cells were isolated from recipient spleens and dCK expression level compared to endogenous dCK of CD45.1+ B6.SJL recipient. (B) In vitro dCK kinase assay using [3H]-dC and lysates of dCK KO donor CD45.2+ (dCK+YFP+ or dCK−YFP−) cells FACS purified from spleens of B6.SJL recipients (N = 3 mice per group). (C) Cellularity of B6.SJL thymi repopulated with dCK KO donor cells carrying different dCK isoforms (CD45.2+YFP+; N = 3). (D) FACS analysis of dCK KO ± dCK (WT, S74A, S74E) thymocytes. Bottom panels show pSer139 γH2A.X stained DN3 thymocytes. (E-F) Averaged percentages of single live donor CD45.2+ thymocytes (± dCK/YFP) at different stages of development (N = 3). (G) Averaged percentages of DN3 thymocytes positive for pSer139 γH2A.X (N = 3).

