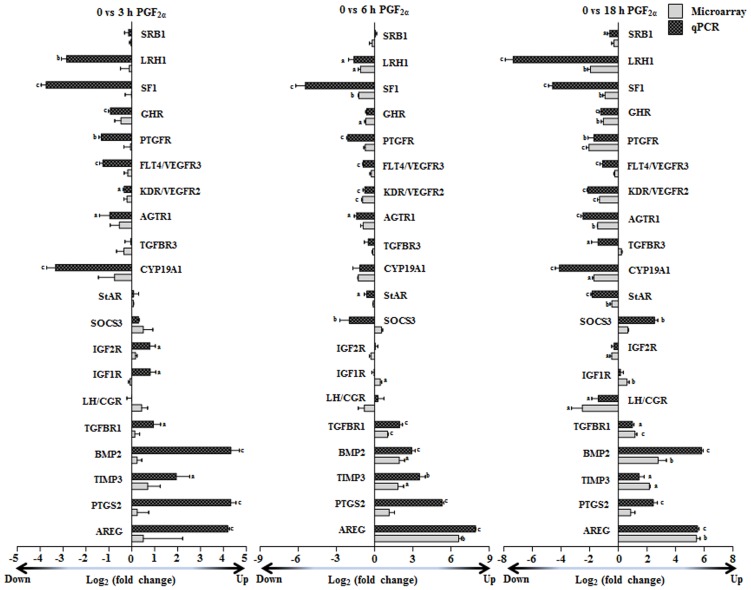
Figure 2. Validation of microarray data and its comparison with qPCR analysis.
Log ratio of microarray fold change expression of the selected 20 up and down regulated genes associated with specific biological process at 3, 6 and 18 h post PGF2α administration in the CL. The genes selected by microarray analysis were subjected to qPCR analysis and log ratio of fold expression changes at different time points post PGF2α administration are represented as bar graphs. Individual bar for each gene represents mean±SEM log2 (fold change) in mRNA expression value for microarray analysis and qPCR analysis at each time point (n = 3 animals/time point). For each gene, bars with different alphabets above them are significantly different (p<0.05).

