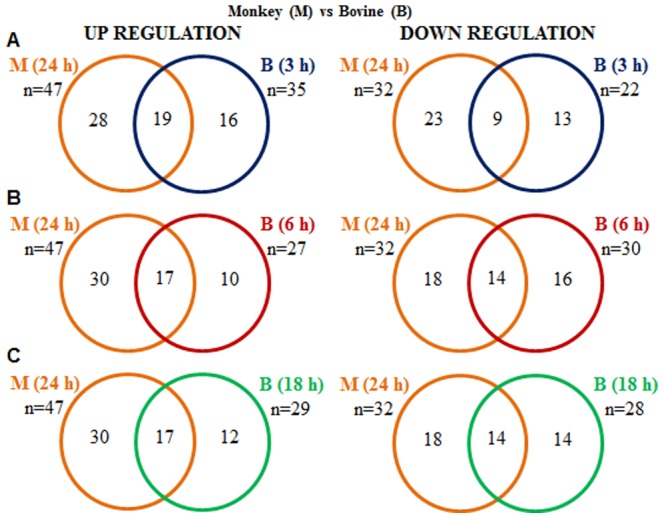
Figure 6. Identification and comparison of differentially expressed E2 responsive genes in the monkey and bovine CL.

Venn diagrams representing the number of differentially expressed E2 responsive genes identified in monkey (M) and bovine (B) microarray data available from the GEO database. Data analyzed by Bioconductor analysis tool employing ≥1 fold change cut-off and statistical filters with Benjamini and Hochberg correction factor for false discovery rate. The circles designated for each time point post PGF2α is represented as orange (24 h, M), blue (3 h, B), red (6 h, B) and green (18 h, B). A comparison of total number of differentially expressed up and down regulated E2 responsive genes found common between 24 h, M vs. 3 h, B (A); 24 h, M vs. 6 h, B (B) and 24 h, M vs. 18 h, B (C) post PGF2α treatment are presented.
