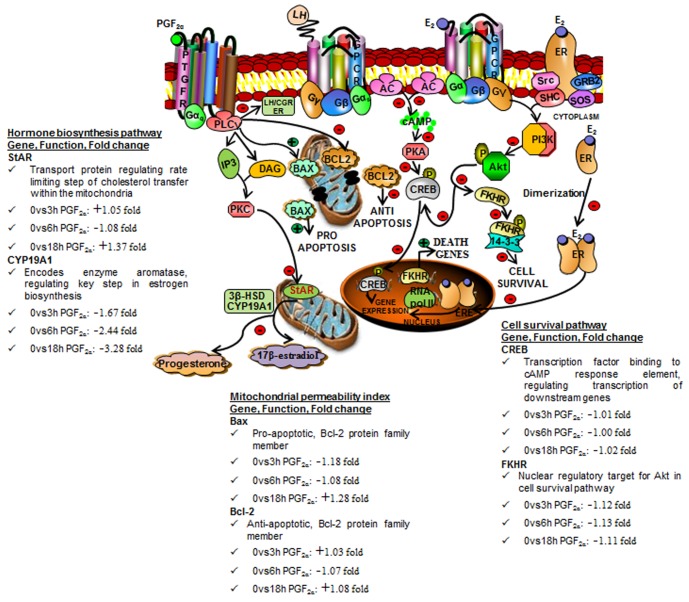
Figure 8. Schematic diagram illustrating a model for PGF2α-induced luteolysis in the bovine corpus luteum.
The model shows interaction amongst various intracellular signaling pathways activated by LH, PGF2α and E2. The luteolysis process induced by PGF2α treatment appears to be a result of distinct molecules that involve hormone biosynthesis pathways (StAR, CYP19A1) which is downstream of PTGFR signaling leading to decrease in serum and luteal P4 and E2 levels. The model also shows involvement of Bcl-2 family members, Bax (pro-apoptotic) and Bcl-2 (anti-apoptotic) that cause changes in mitochondrial permeability to apoptogenic molecules. The model also shows inhibition of cell survival pathway as shown by LH/CGR and ER (both genomic and non-genomic signaling) down regulation and in turn inhibition of downstream molecules (CREB, FKHR). Few of the selected genes out of differentially expressed genes at different time points post PGF2α treatment compared with 0 h PGF2α treatment (StAR, CYP19A1, Bax, Bcl-2, CREB, FKHR) has been provided in the Figure. The information on gene names, general function, fold change in mRNA expression and implicated pathways are represented. The stimulation and inhibition of specific molecules downstream of different signaling pathways are represented by green (+) and red (−) signs, respectively.

