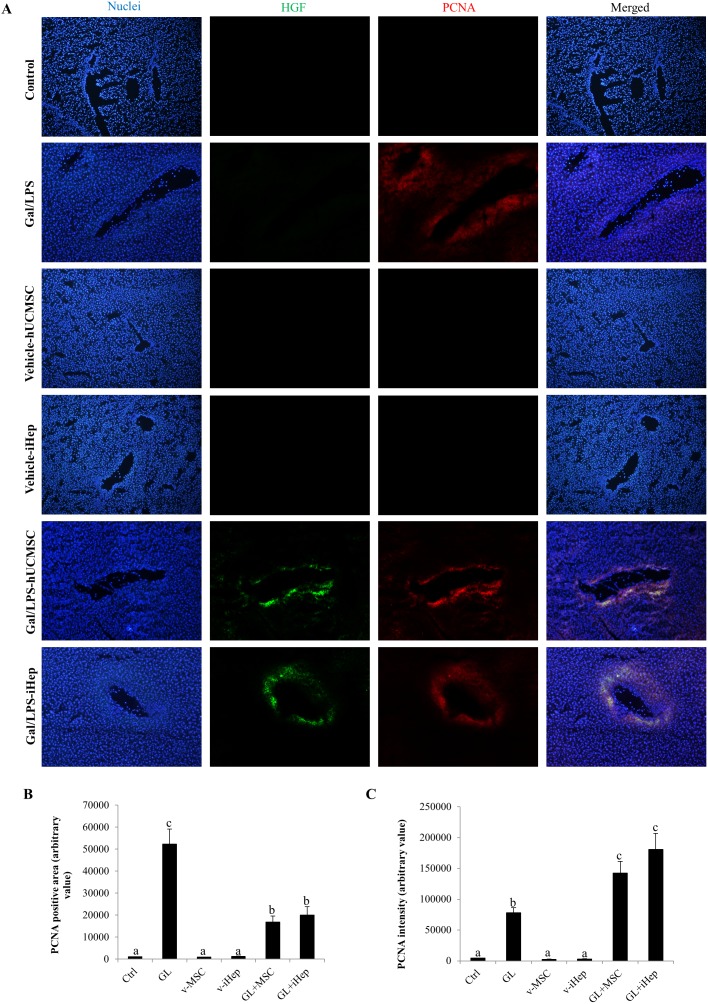
Figure 7. Quantification of expression level of human hepatocyte growth factor (hHGF) of the transplanted stem cells in host liver.
(A) Representative images of hHGF-positive cells (green), which was human-specific, and PCNA-positive nuclei (red), which comprised both human and mouse cells. Nuclei were counter-stained with Hoechst 33342 in blue. Magnification 200x. These images were analyzed by ImageJ software, and the area and intensity of PCNA-positive nuclei in each group was exhibited in panel (B) and (C), respectively. Data were expressed as means ± SEM. Different superscript letters (e.g. a vs b, or b vs. c) represent a statistically significant difference (p<0.05) between two variables.

