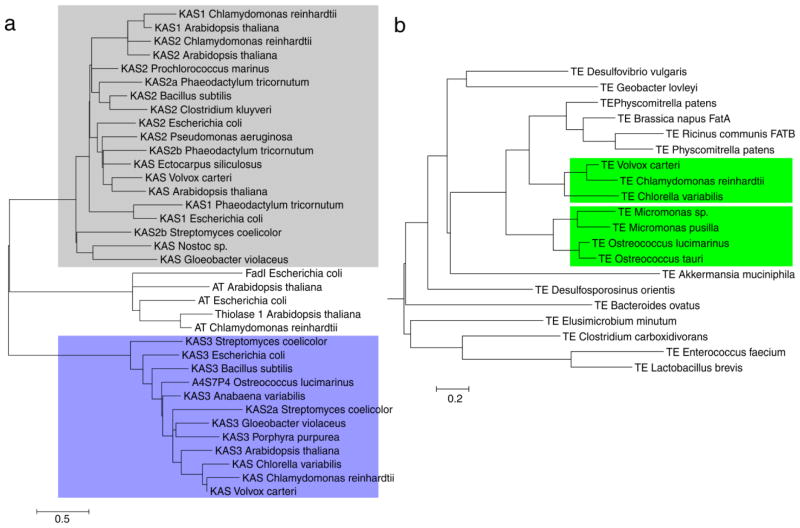
Figure 2.
Phylogenetic analysis of thiolase and thioesterase families. a) Thiolase phylogeny. b) Acyl-ACP thioesterase phylogeny. Full trees of all FAS enzymes can be found in Figures S2–S13. The scale bar represents branch length: the number of amino acid substitutions per 100 residues.

