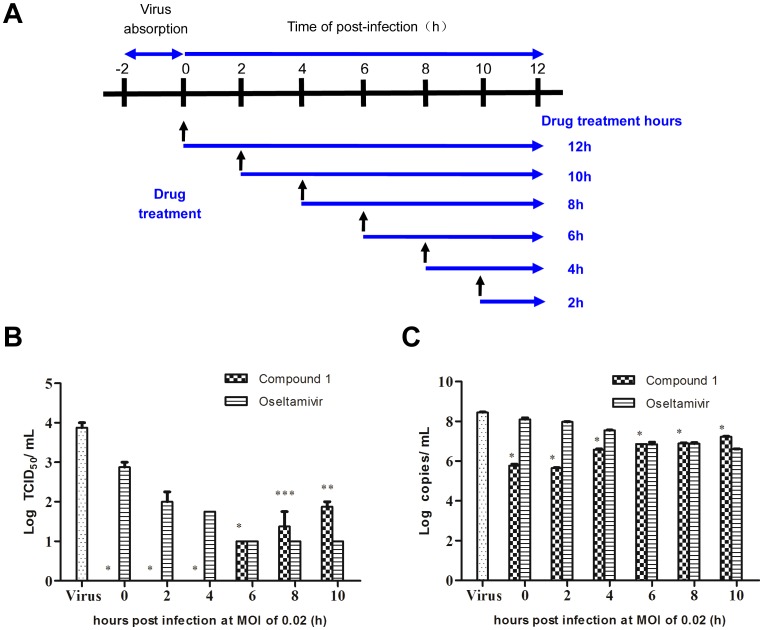
Figure 6. Time course assay of compound 1.
(A) An illustration scheme shows the time of addition of compound 1. (B–C) MDCK cells (2×10⁴ cells/well) in 48-well plates were infected with influenza virus A/PR/8/34 (H1N1) (MOI = 0.02). At post-infection, the medium was discarded and cells were washed with PBS three times. Compound 1 (134.3 µM) or oseltamivir (6.4 µM) was added at 0 h, 2 h, 4 h, 6 h, 8 h and 10 h after infection. At 12 h post-infection, the supernatants were collected and infectious titers were determined by CPE assay (B) and real time PCR assay (C). Data represent mean ± SD of 3 biological samples. Statistical significance was assessed by comparison between compound 1-treated group and virus control group by using student's t-test analysis (* p-value <0.001, ** p-value <0.01 and *** p-value <0.05).

