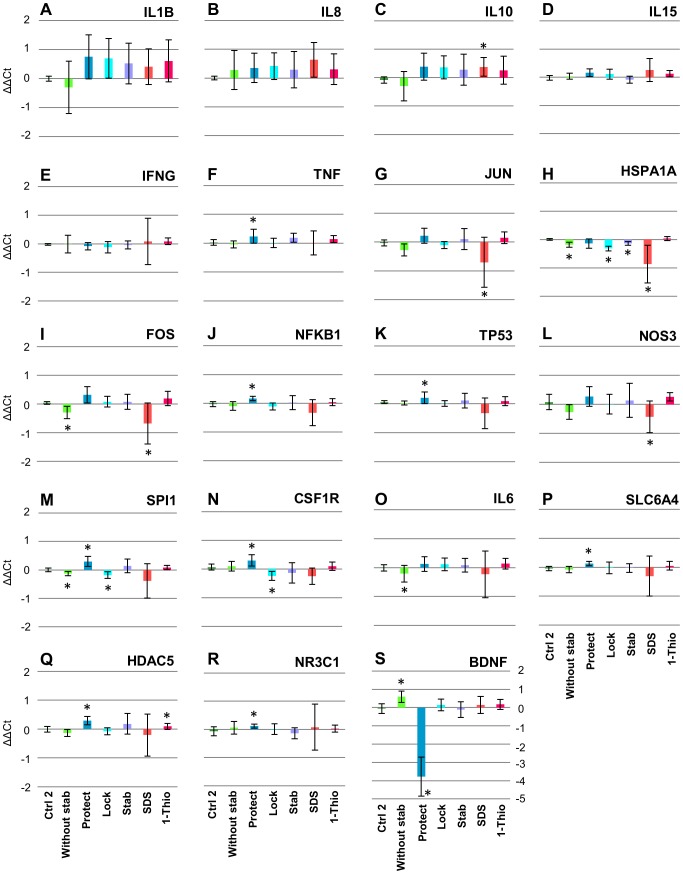
Figure 2. qRT-PCR analysis of 19 target transcripts.
GAPDH and the Ctrl1 condition were used as a reference transcript and condition, respectively. ΔΔCt values are shown by vertical axes. Horizontal axes represent pre-analytical conditions in the following order: Ctrl2, Without stab, Protect, Lock, Stab, SDS, and 1-Thio. *, p<0.05; **, p<0.01 (Wilcoxon signed rank test).

