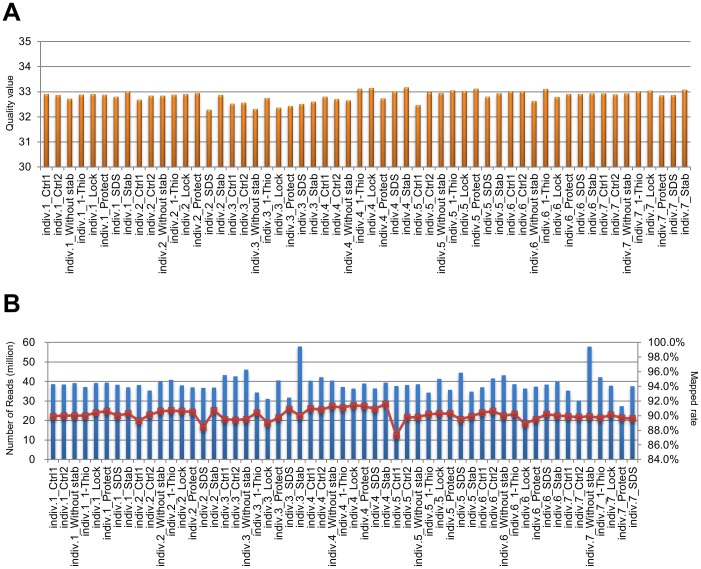
Figure 3. Quality assessment and control of sequencing data from HiSeq2500.
A. Quality values of sequence reads calculated by Cufflinks (Cuffdiff) in each sample. B. The blue bars show the number of sequence reads mapped to the human genome (hs37d5) with TopHat, and the red line with squares indicates the mapped percentage in each sample (B).

