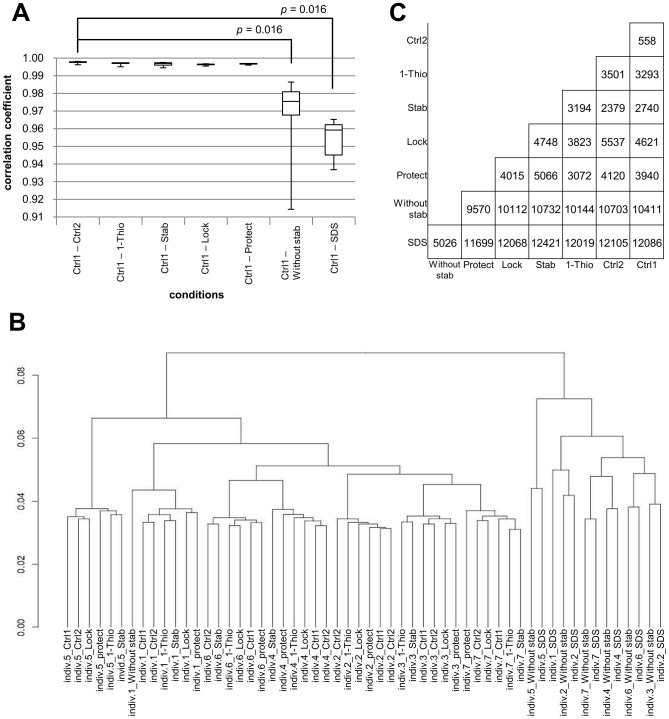
Figure 4. Data bias of transcriptome analysis in each condition.
A. Correlation analysis of the average of FPKM under eight conditions for each sample. B. Cluster analysis of 56 transcriptomes: eight conditions for each of seven volunteers. C. Pair-wise comparisons of significant differences in gene expression for each sample. The number in each box shows the number of differentially expressed genes (p<0.05, Wilcoxon signed rank test).

