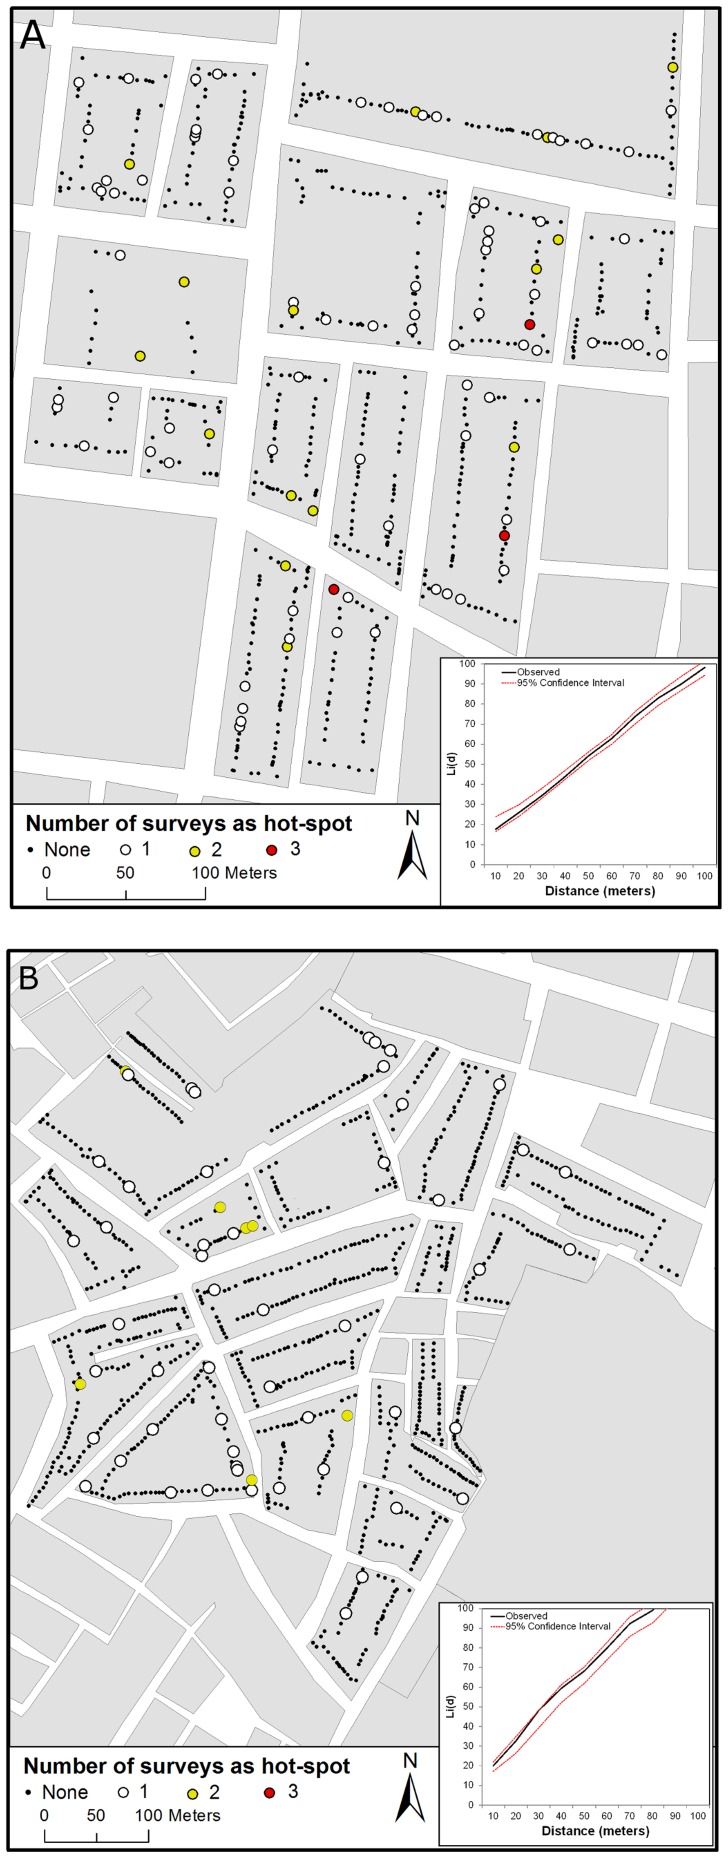
Figure 4. Temporal instability in Ae. aegypti clusters.
Maps show the number of surveys (out of 9 total surveys) a house was a hot-spot of high adult male and female Ae. aegypti abundance for (A) Maynas and (B) Tupac Amaru neighborhoods. Inset in each panel show the result of weighted k-function analysis performed on the number of times a house was a hot-spot. Global clustering occurs when observed values (solid black line) are higher than the expected 95% CI under a random distribution (red dotted lines).

