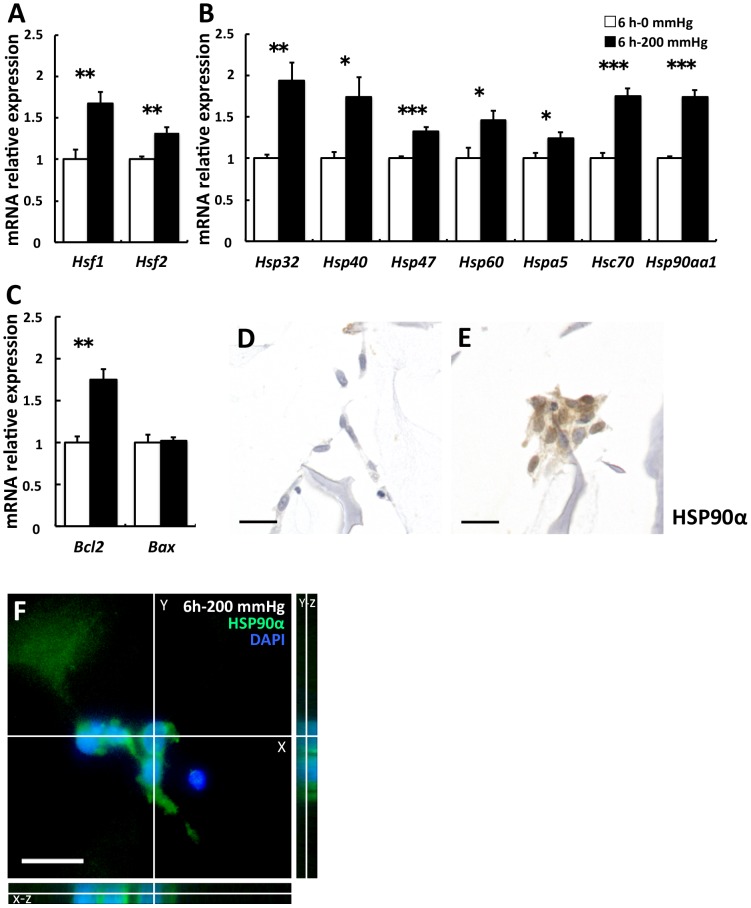
Figure 3. Stress- and apoptosis-related gene expression was stimulated by 6-h compressive loading.
Fibroblasts were seeded to collagen sponge and incubated for 24(□) or 200 mmHg (▪) compression for 6 h. Total mRNA was extracted after WST-1 assay, and mRNA expression was assessed using real-time RT-PCR. The expression of the target genes in the 6 h–200 mmHg group relative to the value in the 6 h–0 mmHg group was calculated by the comparative Ct method using the 18S ribosomal RNA gene as an internal control. The results are represented as the mean ± SEM (error bars) of five experiments. Statistical analysis was performed using the Student’s t test between the 0 mmHg group and the 200 mmHg group, and statistical significance was taken as p<0.05. A value of p was expressed as: *; p<0.05, **; p<0.01, and ***; p<0.001. A: The transcription factors of various Hsps. B: various Hsps C: Bcl2 is an antiapoptotic gene, and Bax is a proapoptotic gene. D and E: Immunostaining for HSP90α. Representative sections of (D) the 6 h–0 mmHg group and (E) the 6 h–200 mmHg group. Higher expression and nucleus translocation of HSP90α was observed in the 200 mmHg group (E) when compared with the 0 mmHg group (D). Scale bars = 20 µm for all images.

