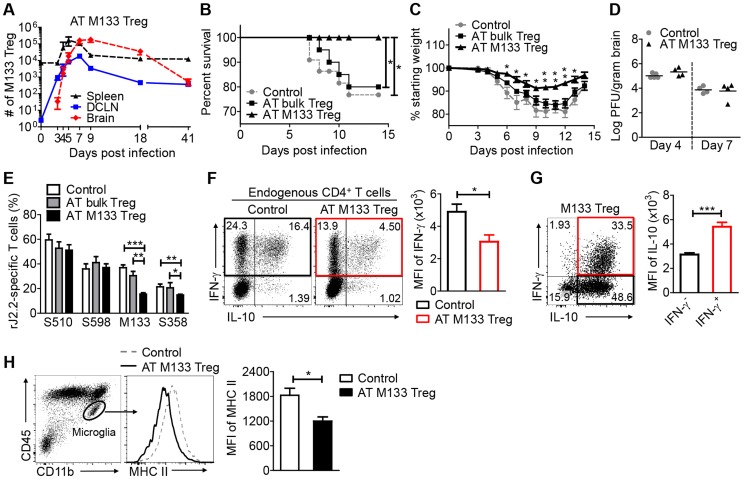
Figure 8. Transferred M133 Tregs enhance survival and diminish the M133 Tconv immune response in the brain.
105 M133 Tregs, bulk Tregs or B6-derived Foxp3−CD4 T cells (control group) were transferred to Thy1 congenic mice one day prior to rJ2.2 infection. (A) M133 Treg numbers in spleen, DCLN and brain of recipient mice from days 0 to 41 p.i. (B–D) Survival (B), weight loss (C) and viral titers in the brains (D) of recipient mice were monitored. 18–22 mice in 4 independent experiments were analyzed for survival and weight loss. In (C), *P<0.05, **P<0.01 weights of M133 Treg recipients compared to mice that received bulk Tregs or control cells; (E–G) Lymphocytes were prepared from brains of recipient mice at day 7 p.i. and stimulated with the indicated peptides. (E) Frequencies of S510 and S598-specific cells within the CD8 T cell population and M133- and S358-specific cells within the CD4 T cell population are shown. 6–10 mice in 3–5 independent experiments were analyzed. (F) Brain-derived lymphocytes were harvested from mice that received control cells or M133 Tregs. Representative dot plots show IFN-γ and IL-10 expression by endogenous CD4 T cells after M133 peptide stimulation. Summary data show expression levels of IFN-γ by M133-specific CD4 T cells in the absence (black) or presence (red) of M133 Treg. (G) Representative dot plots (from the same sample as in F (right hand dot plot)) show IFN-γ and IL-10 expression by exogenous M133 Tregs. Note that lower levels of IFN-γ were expressed by M133 Tregs when compared to Tconv. Summary data show expression levels of IL-10 by IFN-γ- (black) and IFN-γ+ M133 Tregs (red). Data in (F) and (G) are representative of three independent experiments with at least 3 mice/group. (H) Expression levels of MHC II on brain microglia at day 7 p.i. Data are representative of three independent experiments with 3–5 mice/group. *P<0.05, **P<0.01, ***P<0.001.

