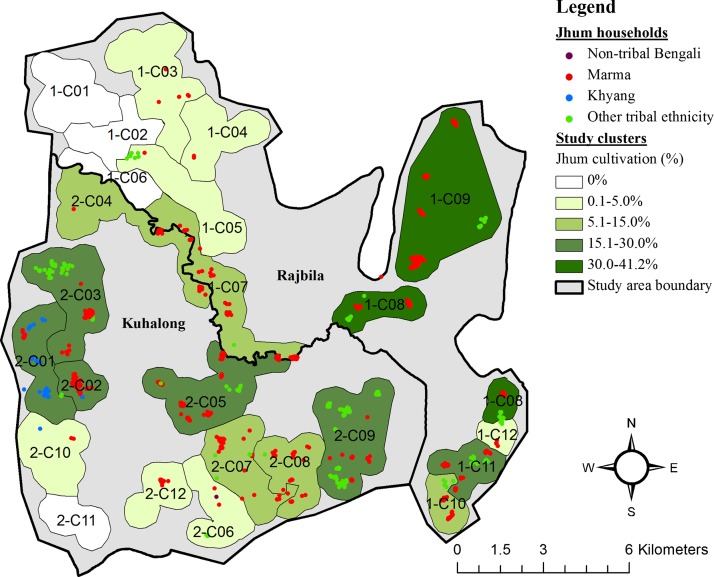
Figure 3.
Locations of jhum households by ethnicity and study clusters labeled by the proportion of inhabitants who participated in jhum cultivation. Surveillance staff collected GPS locations for each household in the study area. Household locations were mapped in ArcGIS and labeled by ethnicity. Programmatic study clusters were also mapped and labeled by the percent of the total population that participated in jhum cultivation.

