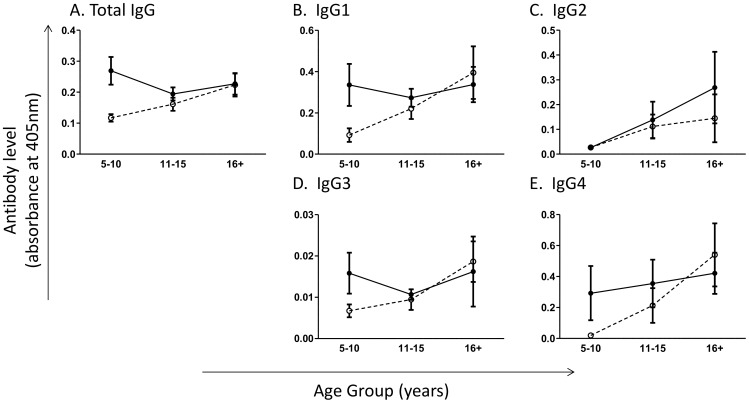
Figure 2. Total adult worm-specific IgG levels differ by age group in healthy participants but not schistosome patients.
Adult worm specific (A) total IgG, (B) IgG1, (C) IgG2, (D) IgG3, (E) IgG4 responses by age group and infection status measured by ELISA. Open circles and dashed lines, healthy individuals; closed circles and solid lines, schistosome patients. Bars represent standard error of mean. Significant differences between schistosome infected and uninfected participants within age groups according to sub-group analysis are indicated by p: ** p≤0.005, *p≤0.05.

