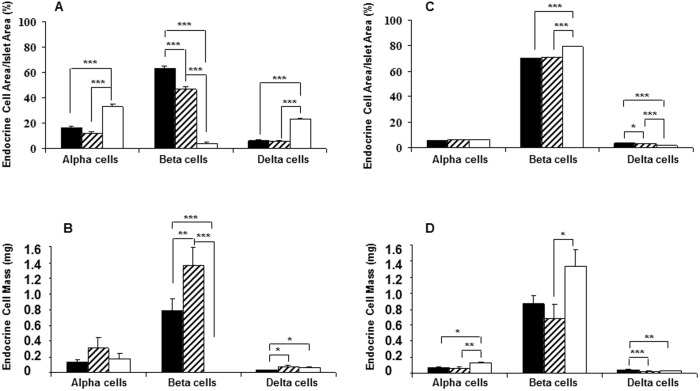
Figure 1. Changes in islet endocrine cell populations during progression of autoimmune diabetes.
Alpha, beta and delta-cells were quantified as a percentage of total islet area (A) and total endocrine cell mass (B) in 4-wk old diabetes-prone (black bars), 12-wk old insulitic (hatched bars) and 18–24 wk old diabetic (white bars) female NOD mice. Endocrine cell area (C) and mass (D) was quantified similarly in age-matched female Balb/c mice. Significant changes among groups are indicated as: *p<0.01, **p<0.001 and ***p<0.0001.

