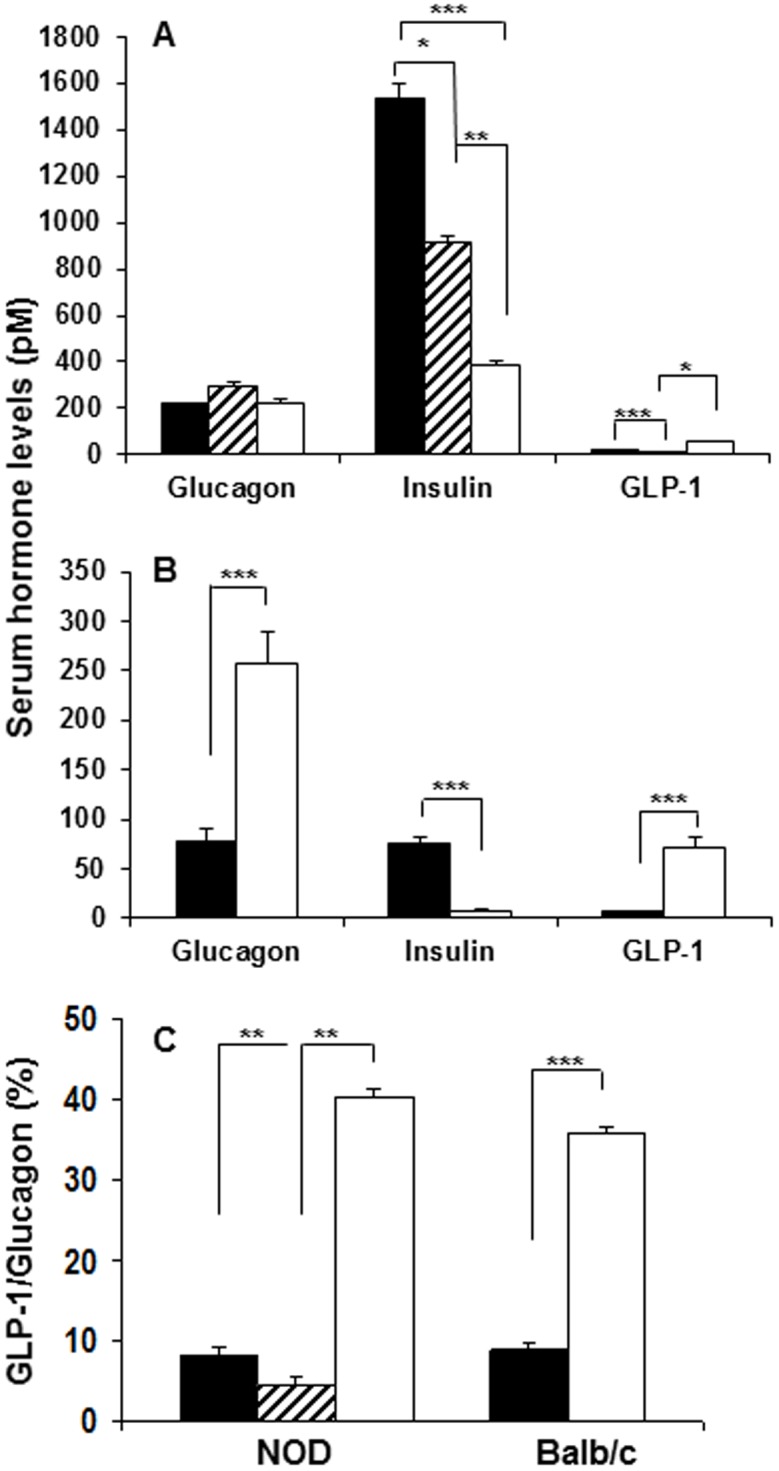
Figure 8. Serum hormone levels reflect changes in endocrine cell mass.

Levels of glucagon, insulin and GLP-1 in serum from 4-wk old diabetes-prone (black bars), 12-wk old insulitic (hatched bars) and 18–24 wk old diabetic (white bars) female NOD mice (A), and in 12 wk old Balb/c mice without (black bars) or with (white bars) STZ-induced diabetes (B). The ratios of the proglucagon gene products in percent is given for both the NOD and Balb/c mice (C). Significant changes among groups are indicated as: *p<0.01, **p<0.001 and ***p<0.0001.
