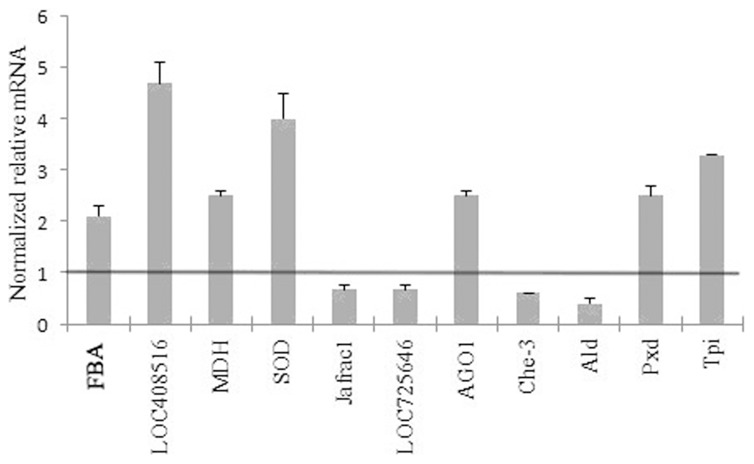
Figure 7. Verification of 11 differentially expressed proteins at mRNA level by qRT-PCR analysis.

The normalized relative mRNA levels (>1) of the genes of the corresponding differentially expressed proteins indicate up-regulation and those (<1) indicate down-regulation. Error bar is standard deviation. The names of the proteins are referred in Table 2.
