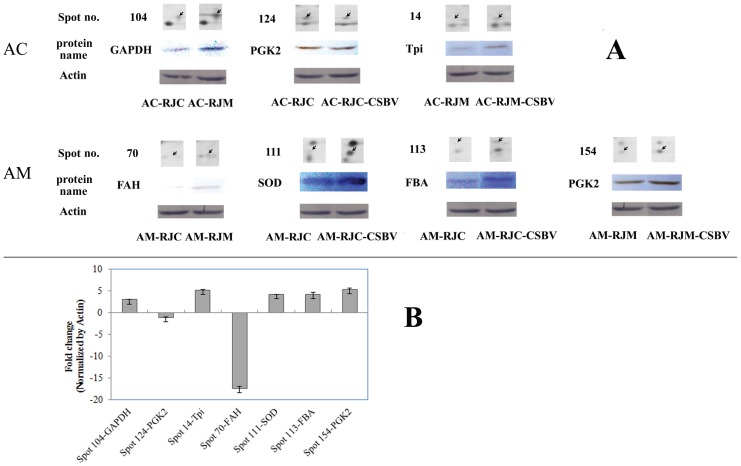
Figure 8. Western blot Analysis of differentially expressed proteins.
Six proteins were selected. Proteins were separated on a 12% SDS-PAGE gel and immunoblotted with anti-GAPDH, anti-PKG2, anti-Tpi, anti-FAH, anti-SOD, and anti-FBA. β-actin was used as an internal control. (A) The Western blot images of GAPDH, PKG2, TPI, FAH, SOD, FBA and Actin. The protein spots from Figure 2. (B) Quantification of target protein expression.The relative fold change of GAPDH, PKG2, Tpi, FAH, SOD, FBA (normalized by Actin) was visulized by using Quantity One Software. The expression of GAPDH, SOD, FBA and Tpi were up-regulatedd. On the other hand, FAH and PGK were down-regulated. Error bar is standard deviation.

