Figure 3.

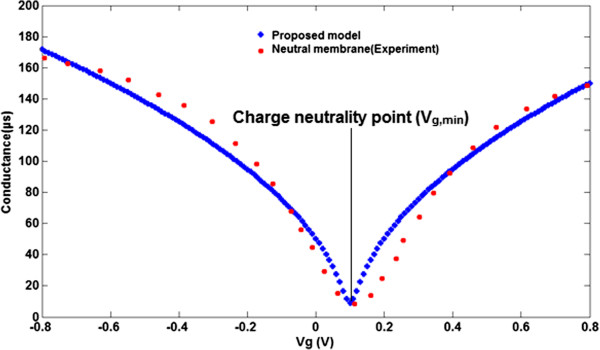
Comparison between bipolar transfer curve of conductance model (blue line) and experimental extracted data (red line) for neutral membrane.

Comparison between bipolar transfer curve of conductance model (blue line) and experimental extracted data (red line) for neutral membrane.