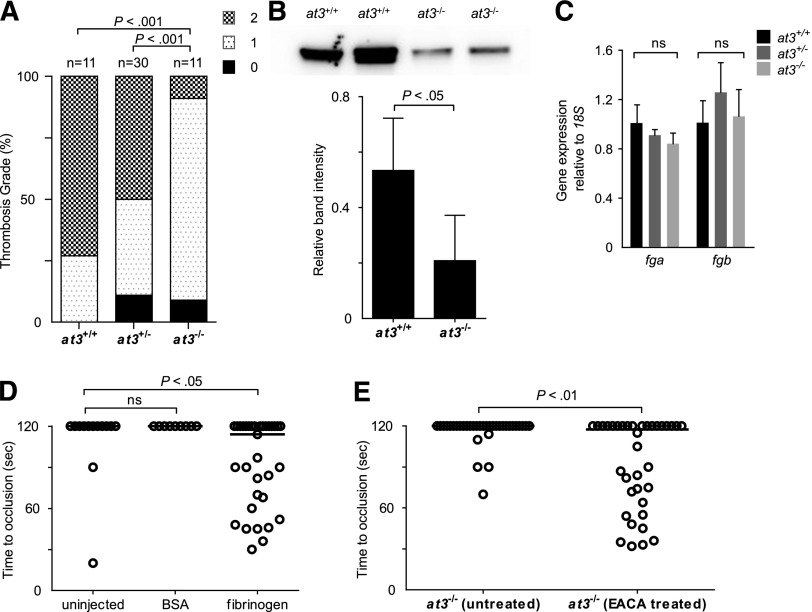
Figure 5.
Evidence for fibrinogen consumption in at3 homozygous mutant larvae and adults. All data shown are from Δ90 mutants. (A) Thrombin injection of larvae derived from at3+/− incrosses at 4 dpf. Bar graph represents percentage of each thrombosis grade. Grade 0, normal flow within the PCV and dorsal aorta; grade 1, partial obstruction of flow in the PCV and dorsal aorta due to thrombus formation; grade 2, complete obstruction of flow. Statistical significance was determined by Fisher exact test. (B) Top: Western blot analysis of fibrinogen in adult plasma isolated from at3+/+ and at3−/− clutchmates. Bottom: Quantification of fibrinogen in plasma from at3+/+ and at3−/− clutchmates from 3 separate experiments, n = 4 per genotype. Error bars represent standard deviation and statistical significance was determined by a paired t test. (C) Quantitative real-time PCR demonstrates no significant difference of fga and fgb mRNA expression in at3+/+ and at3−/− clutchmates (3 dpf, n = 15 per genotype). Error bars represent standard deviation and statistical significance was determined by a paired t test. (D) Rescue of time to laser-induced occlusion by human fibrinogen injection at 3 dpf. at3−/− mutant clutchmates were injected with human fibrinogen or BSA. Uninjected (n = 13), BSA injection (n = 9), and human fibrinogen injection (n = 33). (E) Effects of EACA (100 mM) pretreatment on at3−/− larvae. Untreated (n = 34), EACA treated (n = 36). Circles represent individual larvae. Statistical significance was determined by the Mann-Whitney U test. Horizontal bars represent the median time to occlusion. BSA, bovine serum albumin; EACA, ε-aminocaproic acid; ns, nonsignificant.

