
Figure 1.
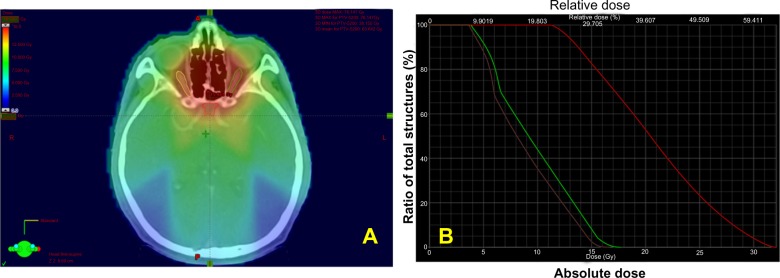
Color wash and dose-volume histogram.
Note: The radiation dose distribution at the optic chiasm (red solid line), and the left (green solid line) and right (purple solid line) optic nerves are shown in a color wash (A) and dose-volume histogram (B).